2016 vs Today

Friends,
Keep reading for a 2016 vs Today snapshot of the local real estate market, and what the last decade can teach us about the next.
Before we get into the housing market, a quick word on Minneapolis, and ICE raids across the country, including our communities.
Like everyone reading this, the last few weeks have left me feeling angry, and sad. I won’t pretend to have anything profound or uniquely insightful to say, but would like to share a few thoughts that have stuck with me from conversations over the last 10 days.
We have to work together.
Activism comes in many forms. The conflict is urgent, and it is also complex. Above all, we should be asking ourselves what we can do to protect the most vulnerable members of our community (immigrants), and how we can help.
This requires actions : calling our elected officials, protesting peacefully, donating to immigrant legal funds, reporting ICE presence, being prepared for increased raids, and a thousand other ways to support the cause. All of these actions are important, and it would be unrealistic to expect someone to do it all. It takes an entire community to work together.

Hope to see you here on Saturday.
It is also important to embrace moments of joy when you can. I know there can be an underlying feeling of guilt when you are having fun in a dystopian era, but it is essential to the human spirit, and to persevere during these dark times.
Ok, last thing, then I’ll climb off my soap box… if someone is not posting ANTI-ICE content on their social media, that doesn’t mean that they are on the sidelines or secret MAGA sympathizers. People will channel their energy into different things (like working through their feelings in a newsletter), and find their role in the coalition. It’s up to all of us to welcome them.
Here are a few practical resources :
Washtenaw Interfaith Coalition for Immigrant Rights
Donations are used to cover urgent community member needs including rent, legal fees, and other emergency costs. Their most urgent need is for Spanish-speakers to support their urgent response hotline.
Reports of ICE presence, protests, grassroots organizing
Provides phone scripts and makes it very easy to call your Senators using this App.
Let’s work together.
As always, thanks for reading.
2016 vs Today
Ten years ago, I was selling Subarus, eating lunch at Kosmo’s three days a week, and perpetually getting lost in the woods with Jasper.
I was living in a Water Hill rental with some ERB Institute grad students where the thermostat was permanently set to 55. When I wasn’t selling Outbacks or drinking tea to stay warm, I was maniacally logging miles through Barton Hills, trying to qualify for Boston (it took me two more years, but I did it in 2018).

Winter 2016
Ten years later, both of our beards have turned salt & pepper, though Jasper has aged far more gracefully than me. Our hikes have gotten shorter and slower, but we still love the outdoors.

December 2025
I traded in my job selling cars for a career helping friends find homes. Obsessively studying the local market, building relationships with tradespeople, and providing clients with an edge in negotiations is far more rewarding.

October 2025 : touring a home virtually with clients in Champaign, IL
Our house in Ann Arbor stays between 66 and 68 degrees, one of the many upgrades from my bachelor life in 2016. When the weather cooperates, we love watching Jeopardy! and dining al fresco on the deck.
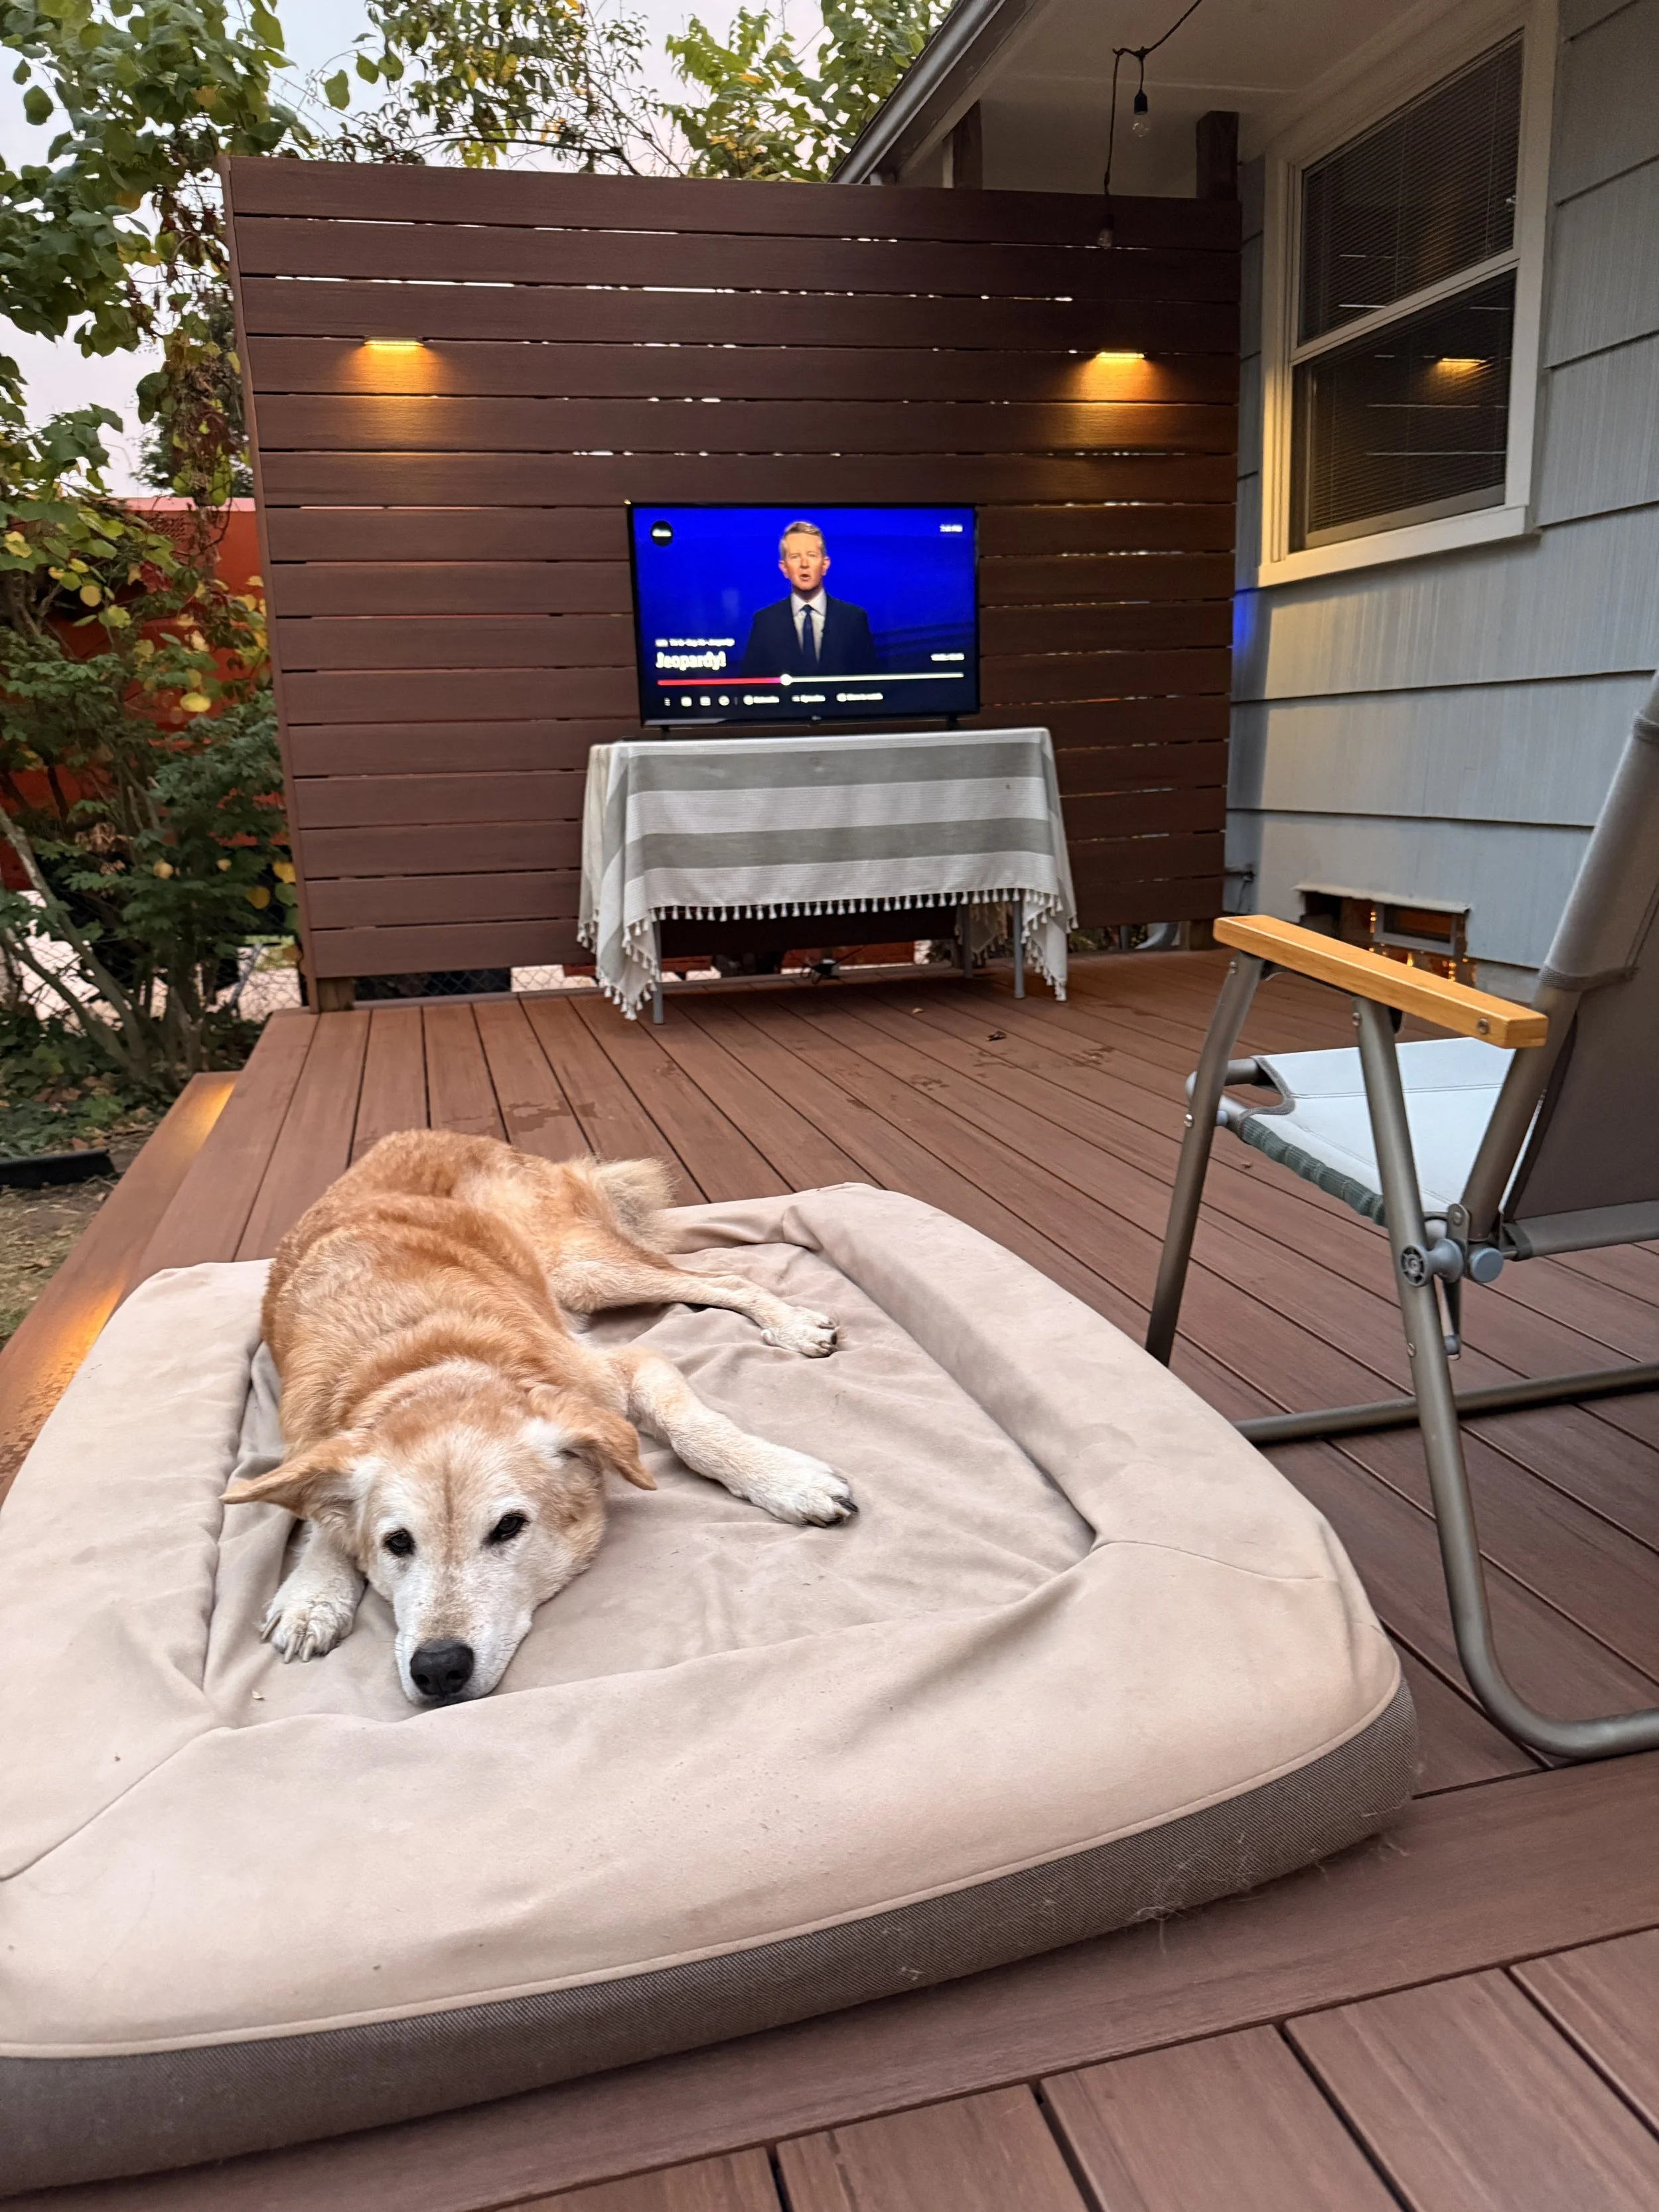
Fall 2025
Kosmo’s is still a staple in the rotation, but Miss Kim is where Chelsea and I find ourselves for most special occasions. The cacio e pepe tteok-bakki is otherworldly.

Winter 2025
2016 vs Today :
Local Housing Market
Starter Homes
Criteria :
3BR Single Family Home
900 - 1500 SQ FT
ANN ARBOR
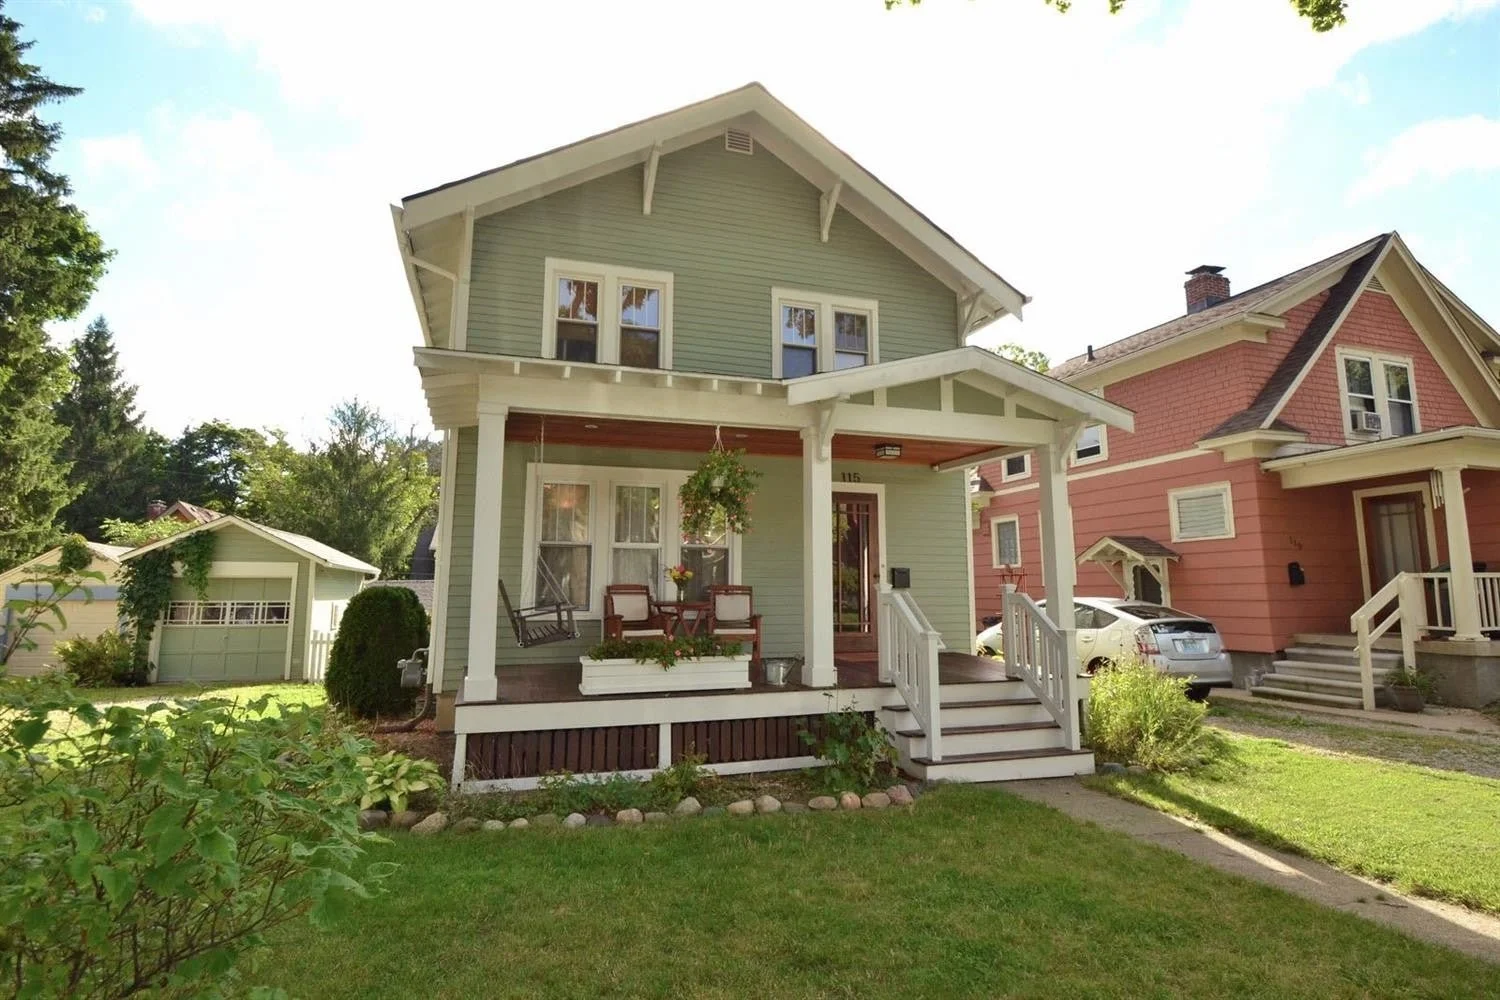
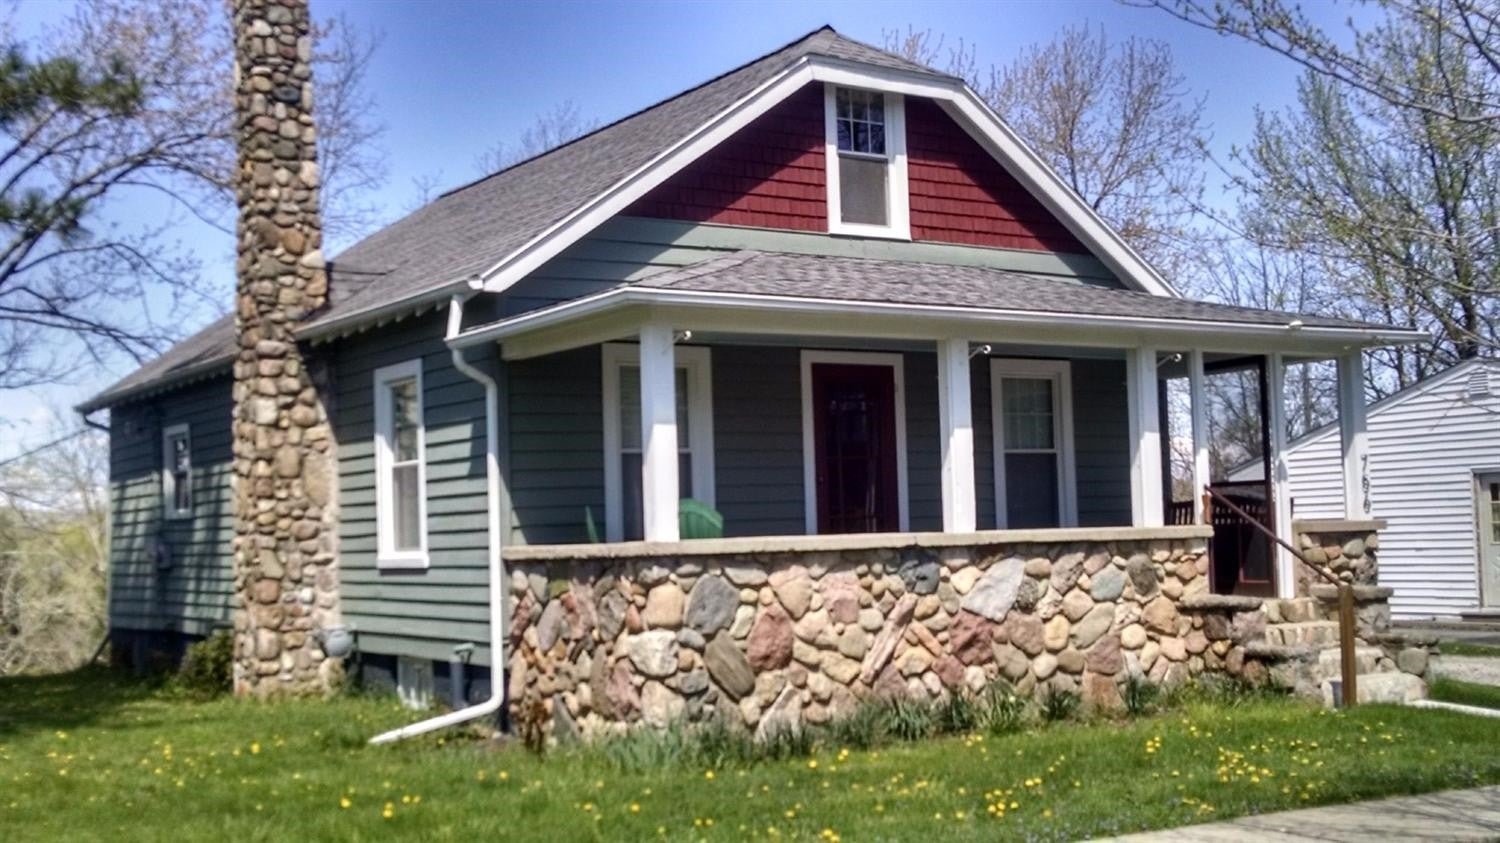
115 Virginia sold for $364,500 in 2016
2016 Stats
Sales : 268
Avg Sale Price : $261,912
Avg $ / SQ FT : $220
Avg List / Sale : 98.77%
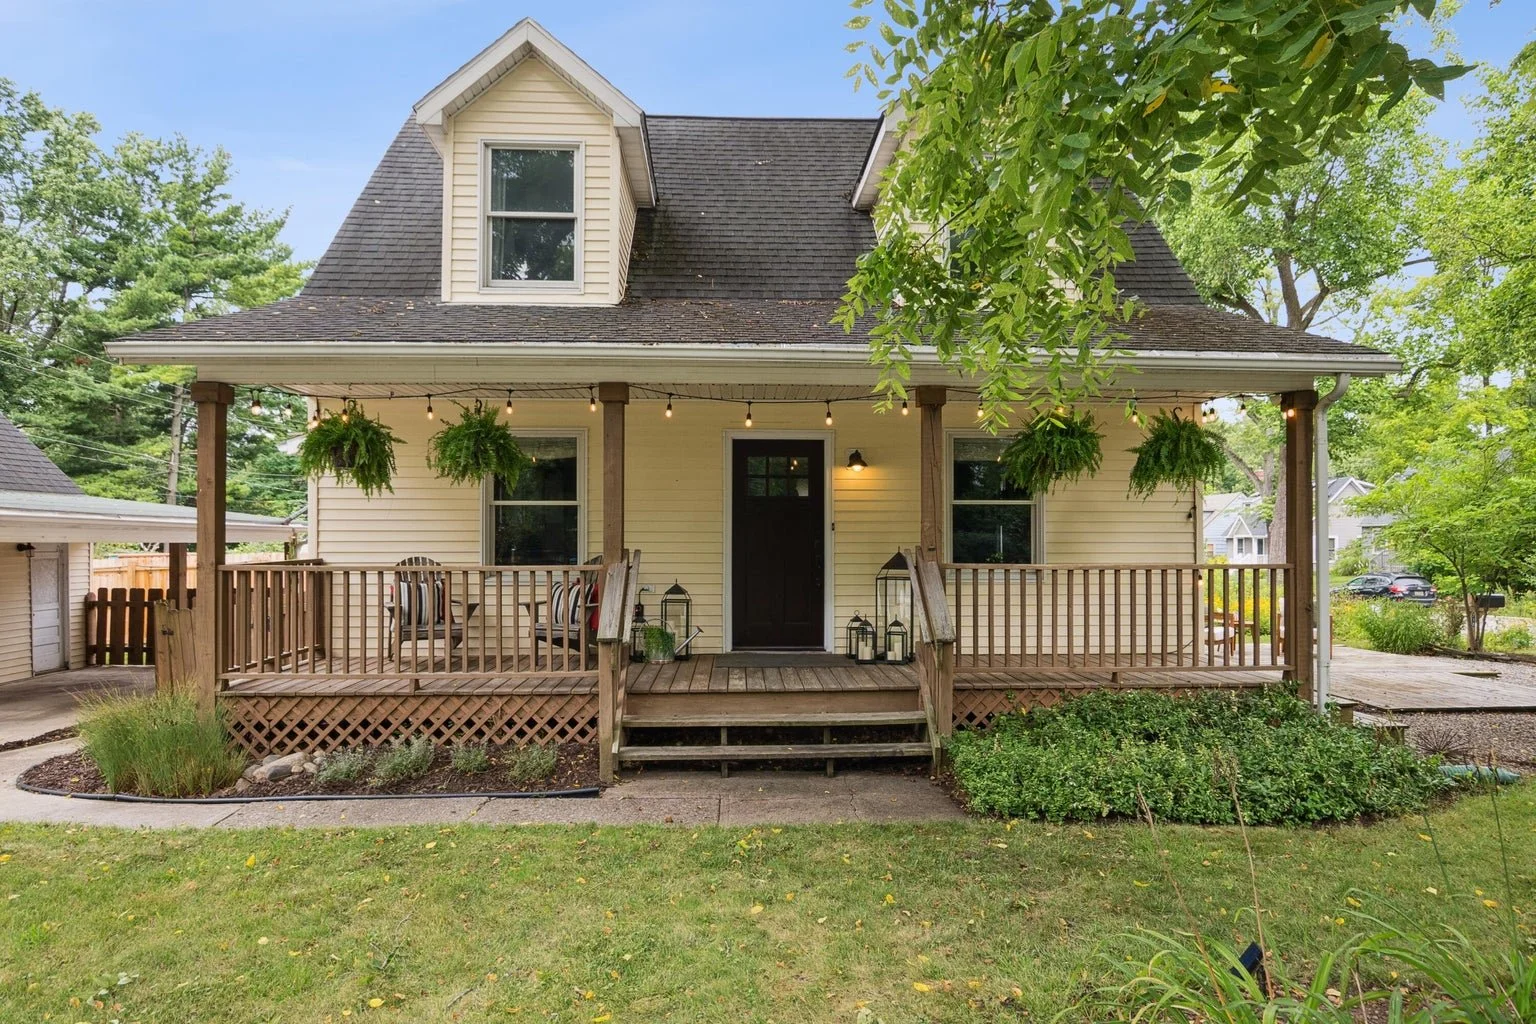
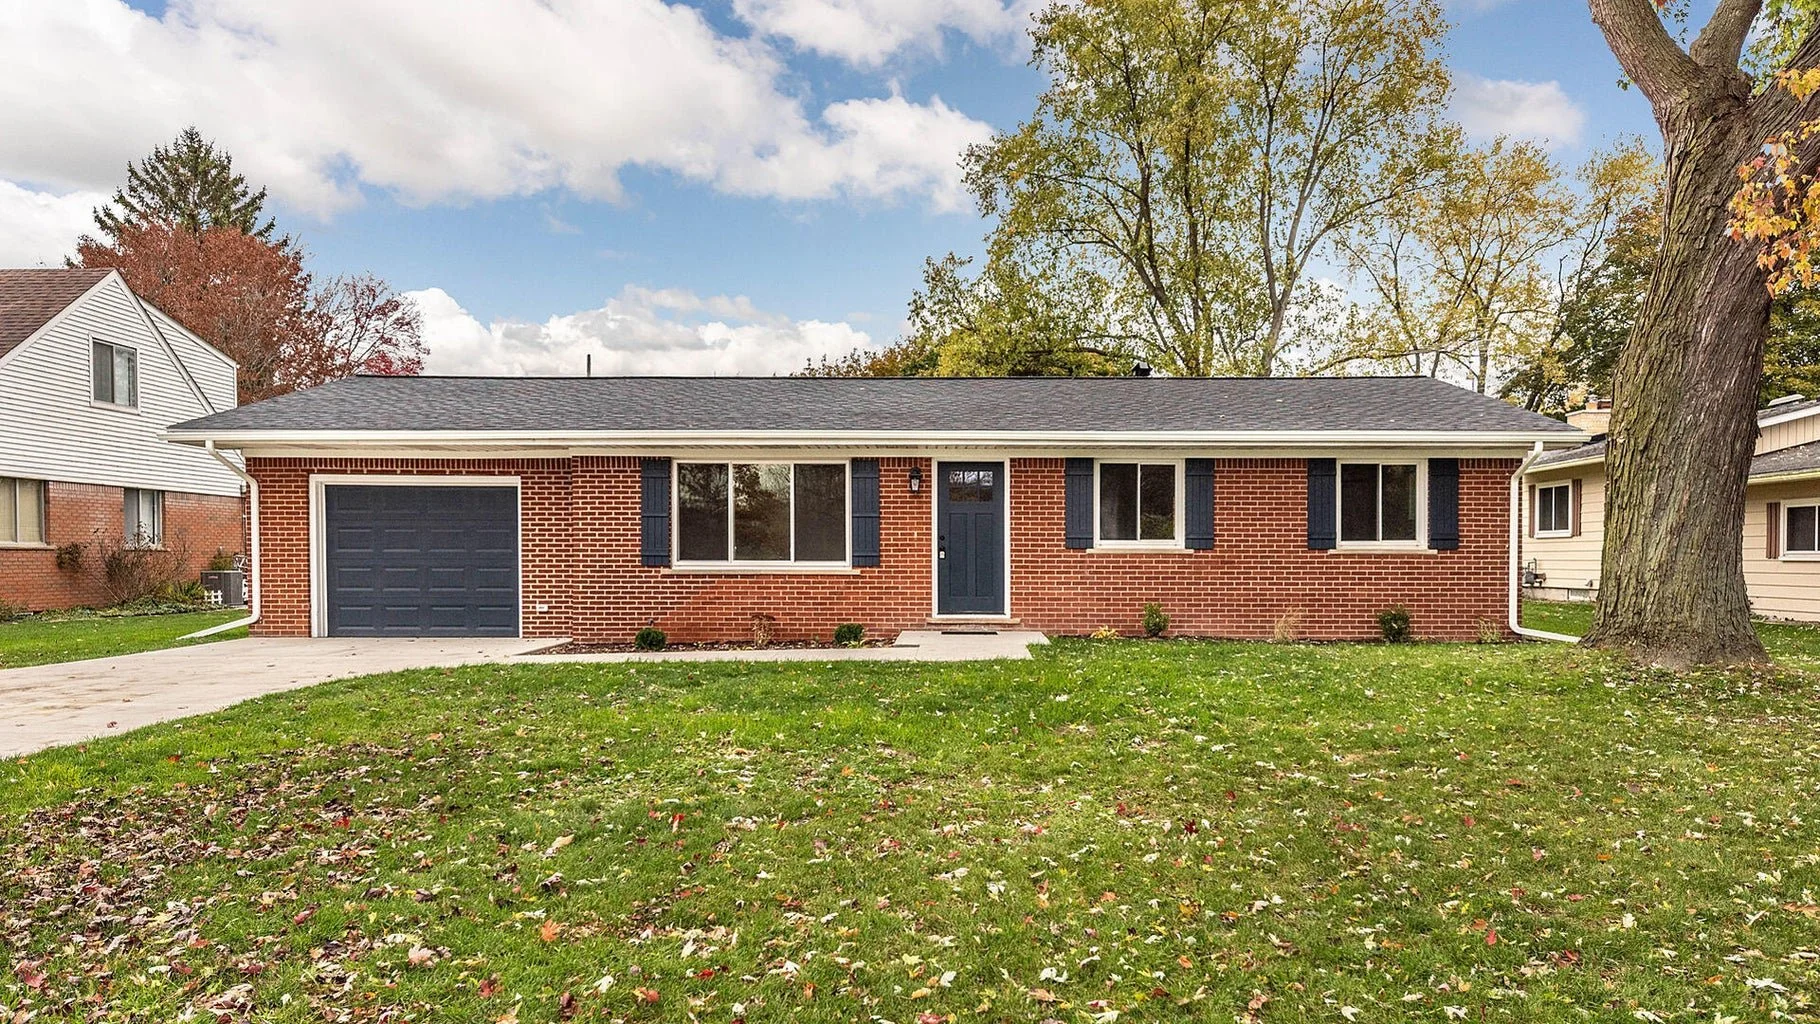
718 Indianola sold for $531,500 in 2025
2025 Stats
Sales : 195
Avg Sale Price : $444,216
Avg $ / SQ FT : $384
Avg List / Sale Price : 99.37%
2016 vs Now :
Number of Sales : - 27%
Avg Sale Price : +69%
Avg $ per SQ FT: +74%
Avg List / Sale : + 0.64%
Ann Arbor Takeaways :
The number of homes available for buyers has dramatically gone down since 2016. This is largely due to seller opportunity cost : selling a starter home means giving up a ~3% mortgage from the 2020-2021 gold rush.
Sellers are mostly moving out of necessity : job changes, divorce, growing families, etc.
The cost to “level up” also got a lot more expensive. In addition to a higher home price, sellers also have to contend with an uncapped property tax increase, and the anxiety of timing their move in order to take advantage of equity built.
Ann Arbor experienced the most gentle increase in sales price and $ per SQ FT. First time buyers have budget limitations, and options outside of Ann Arbor. While the average starter home costs around $444,000, the most popular neighborhoods (Old West Side, Water Hill, Wildwood, Northside, Dicken, Eberwhite) start around $500,000, which is a lot of money for younger buyers without existing home equity.
2026 Forecast : The YoY appreciation rate was modest in 2025 (3.5% increase in $ per SQ FT) after double digit climbs in 2021 and 2022 (10-11%) and 5-6% boosts in 2023-2024. We should see more of the same in 2026, with a gentle increase (2-3%) in starter home prices, even as interest rates are likely to fall below 6%.
Advice to First Time Buyers in Ann Arbor :
Decide what is most important (location, size, repair, updates, backyard for your dog, proximity to schools, etc) and be open to compromise / prioritzing your preferences.
Start your search early. Inventory might perk up a touch this year, but economic / political uncertainty will keep some sellers on the sidelines.
Buy something that fits a 5-10+ year plan. Homes are not likely to appreciate at the same rate as they did during the post-pandemic boom.
It is still a good time to buy. The earlier you get in the game, the lower your property taxes will be down the road, and the more equity / wealth you will build over the next ten years.
YPSILANTI
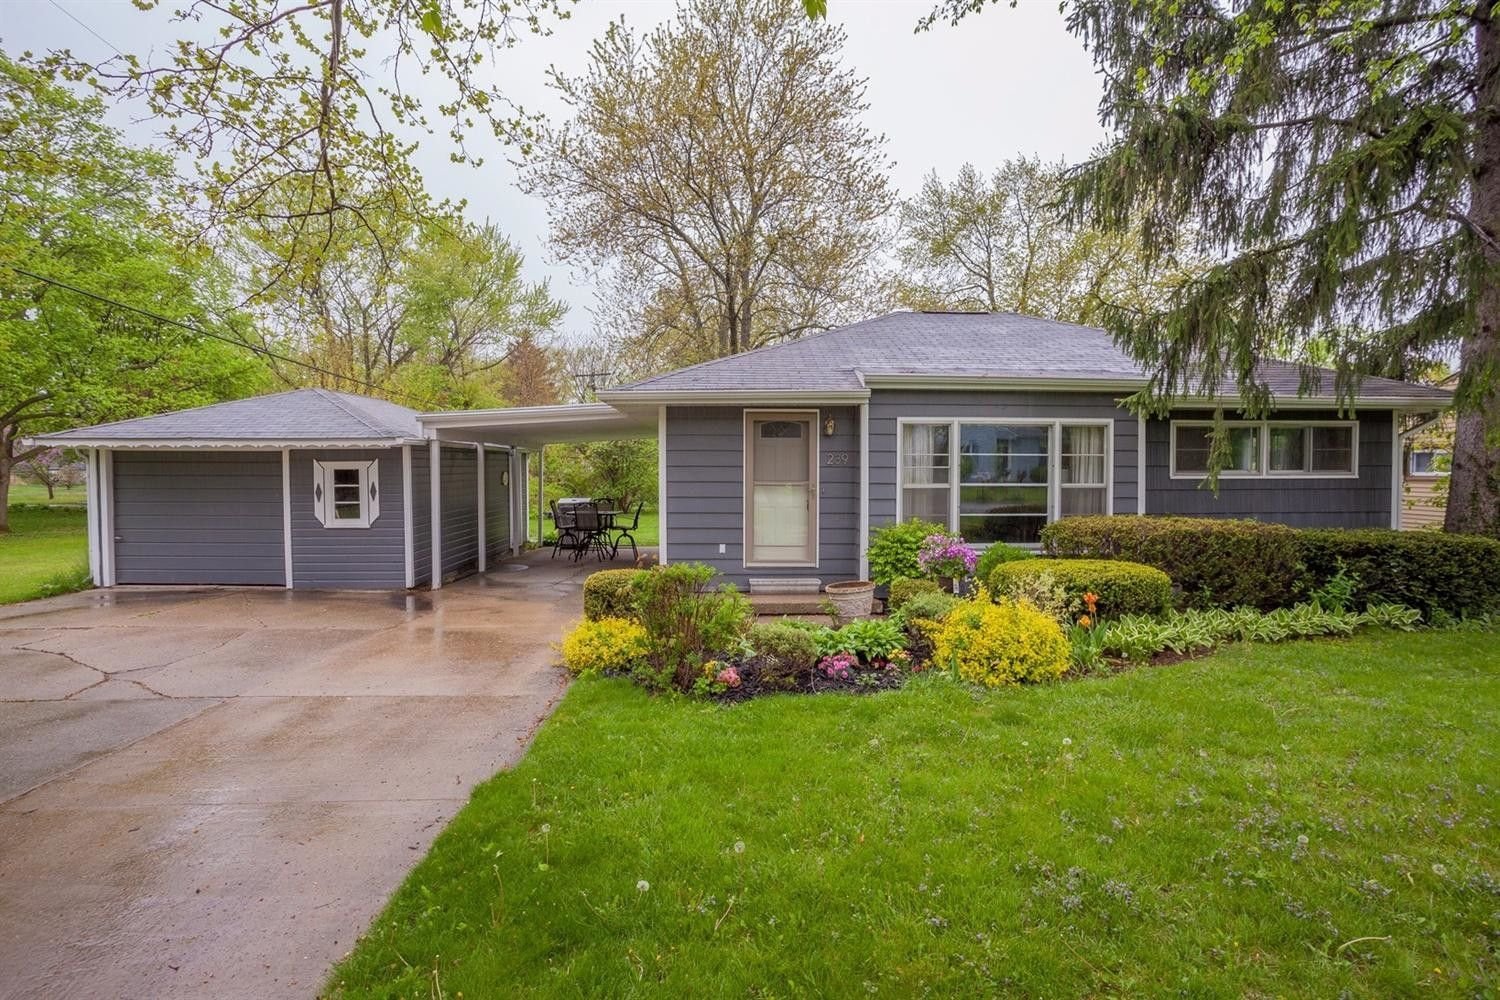
239 Elmhurst in Clubview neighborhood sold for $165,000 in 2016
2016 Stats
Sales : 270
Avg Sale Price : $129,466
Avg $ / SQ FT : $104
Avg List / Sale : 97.33%
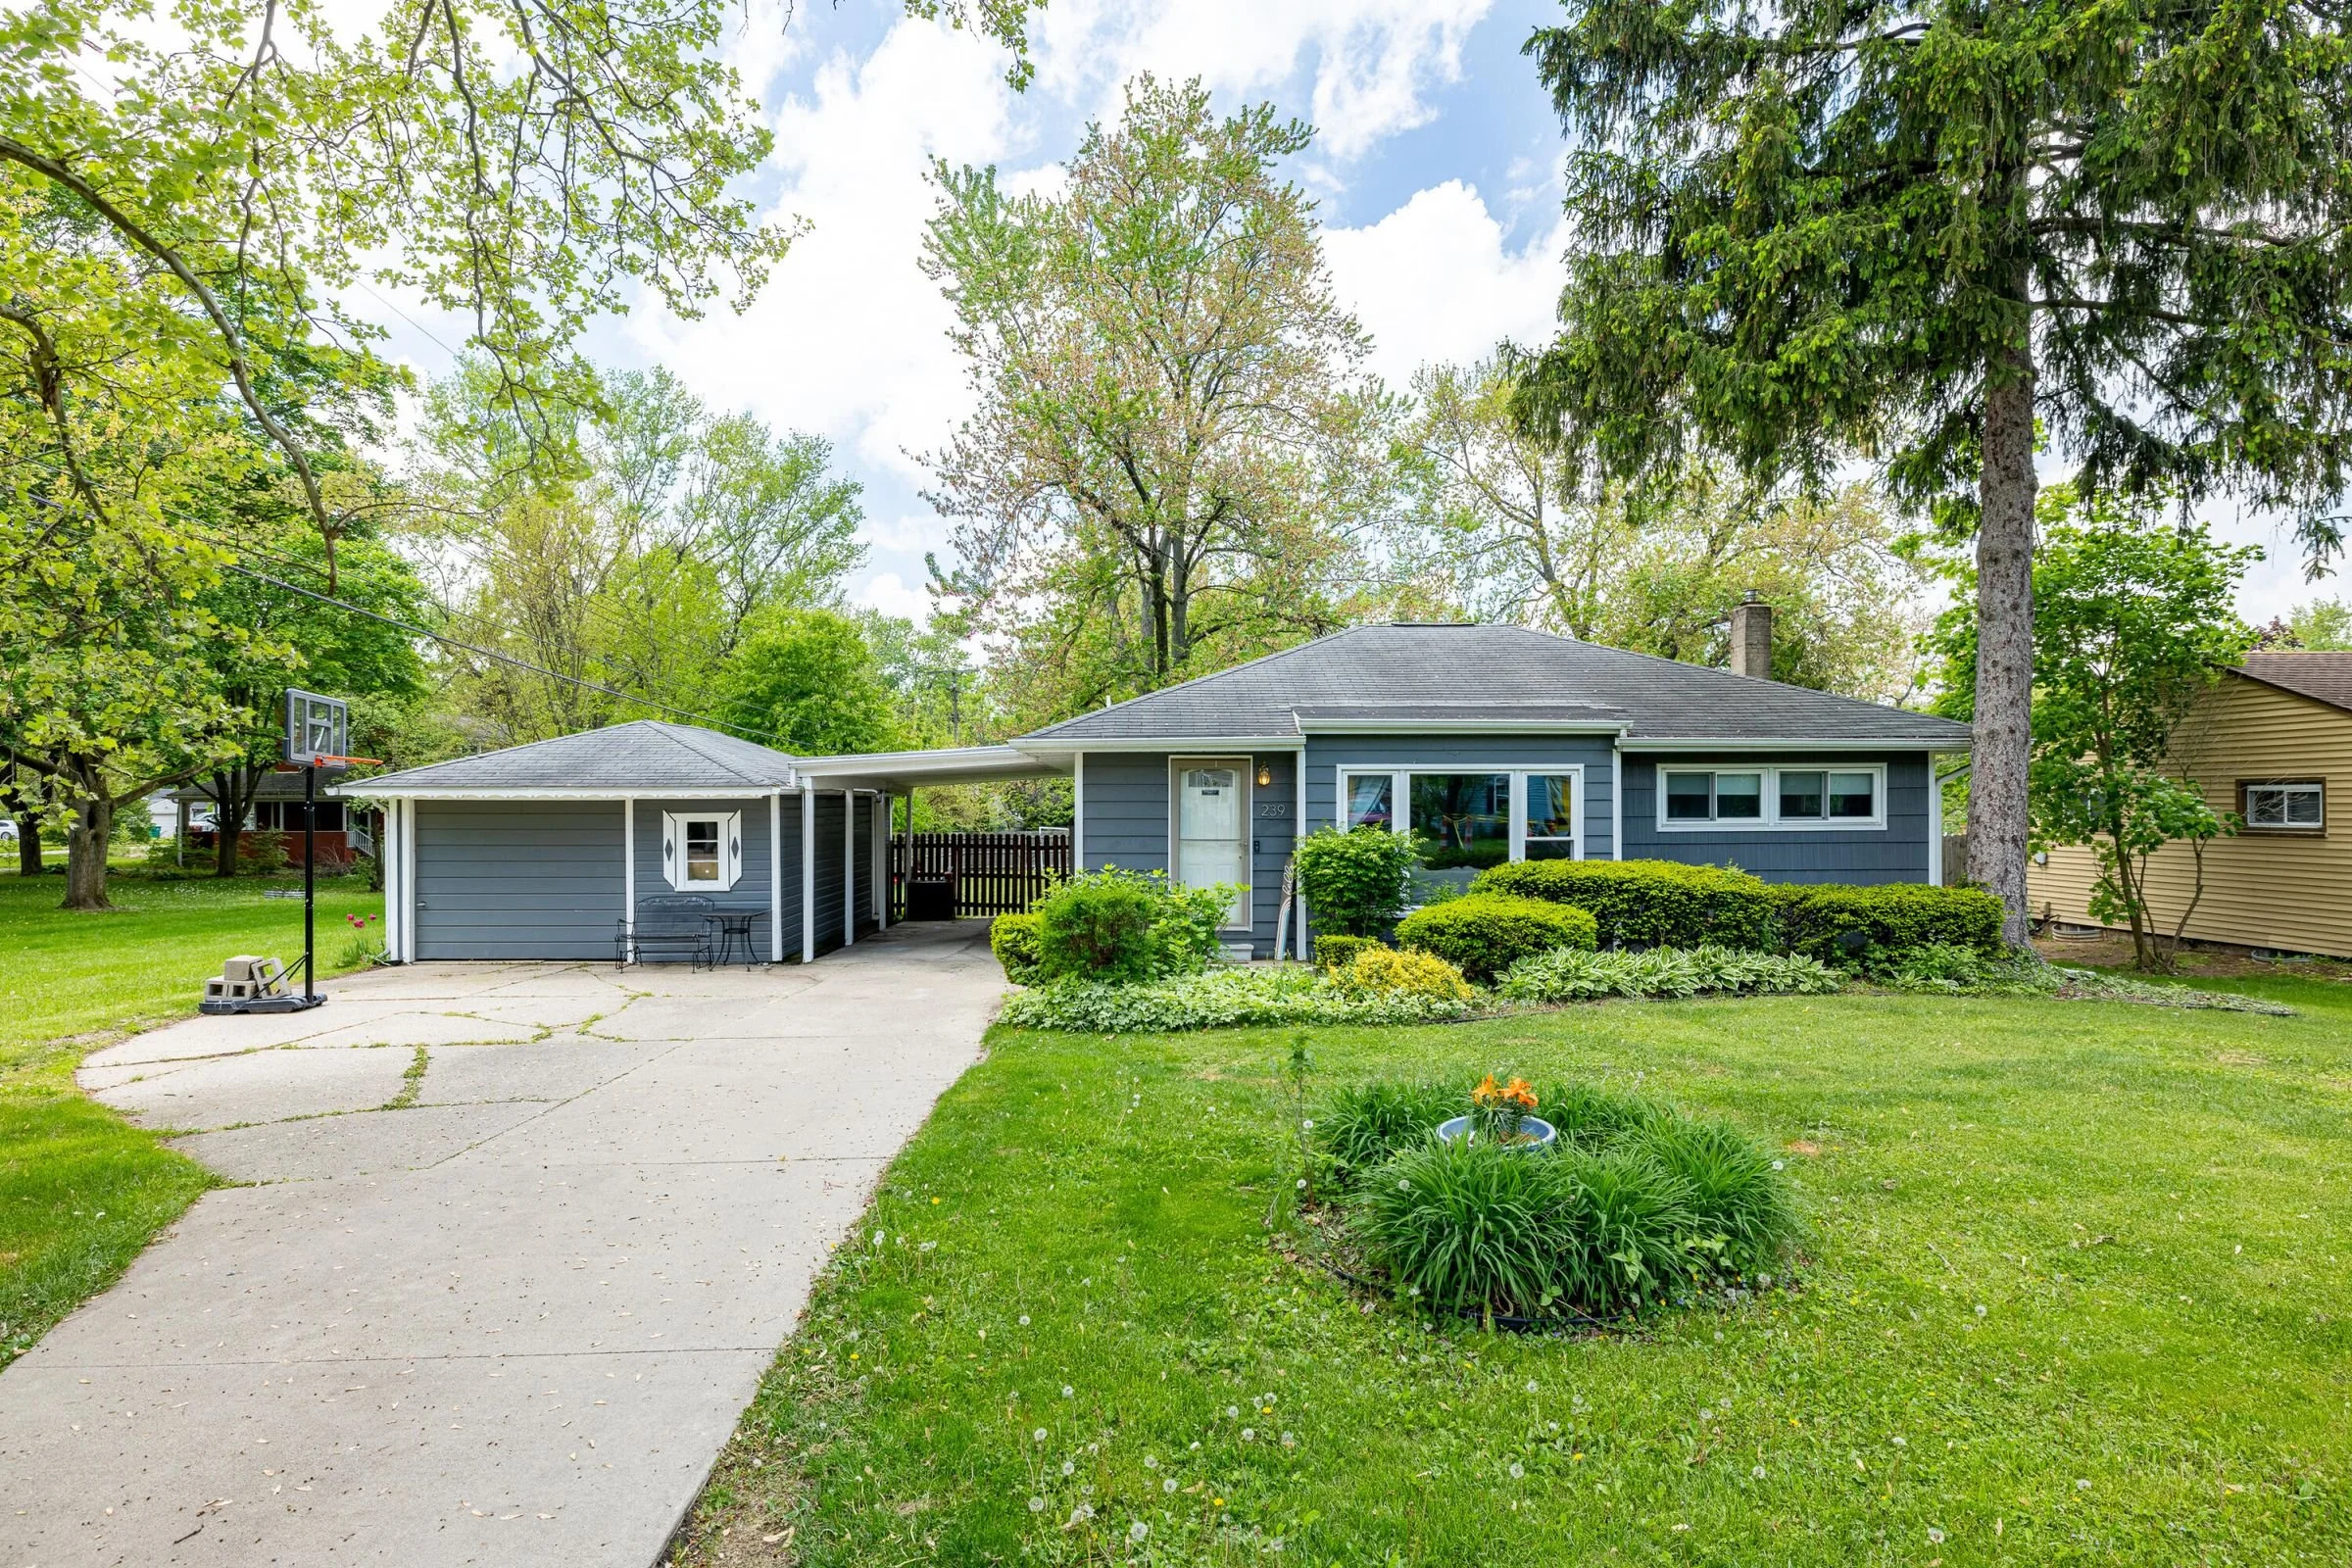
239 Elmhurst (same house as above) in Clubview sold for $325,000 in 2025.
2025 Stats
Sales : 246
Avg Sale Price : $253,215
Avg $ / SQ FT : $225
Avg List / Sale Price : 100.46%
2016 vs Now :
Number of Sales : - 8%
Avg Sale Price : +95%
Avg $ per SQ FT: +116%
Avg List / Sale : + 3.13%
Ypsi Takeaways :
Ypsi had the biggest home value growth over the last ten years.
Taking a closer look at the numbers, homes in Normal Park, College Hts, Depot Town, and Clubview exploded in value, and have gained momentum since 2022 while most neighborhoods have slowed down.
As Ann Arbor became more expensive and out of reach for many first time buyers, Ypsi started to look a lot more attractive.
High city property taxes remain the biggest detractor for Ypsi buyers, but there are homes in Ypsi Twp within two miles of downtown that have become very attractive to younger families.
Advice to First Time Ypsi Buyers :
Check with your lender / realtor for an accurate property tax estimate.
Get to know the local neighborhoods, parks / trails (there are many), and restaurants / local shops.
Check a flood plain map, and the seller disclosures for any water intrusion.
If you like historic homes with charm, consider the Depot Town area.
DEXTER
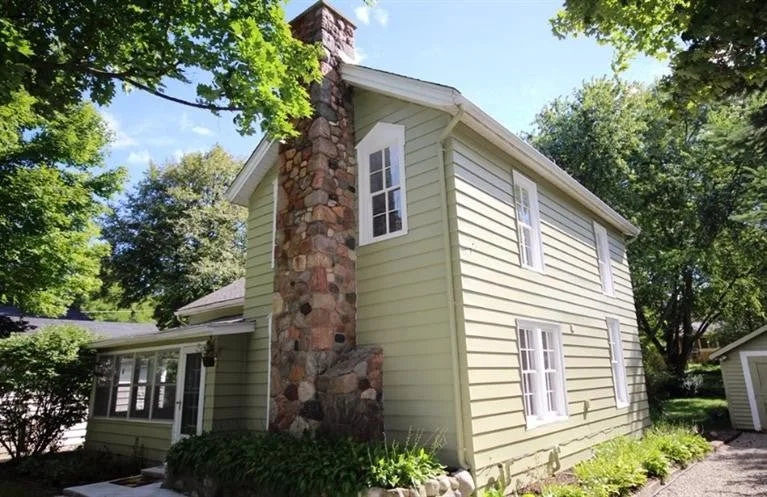
3444 Broad in downtown Dexter sold for $214,900 in 2016
2016 Stats
Sales : 30
Avg Sale Price : $221,763
Avg $ / SQ FT : $172
Avg List / Sale : 95.76%
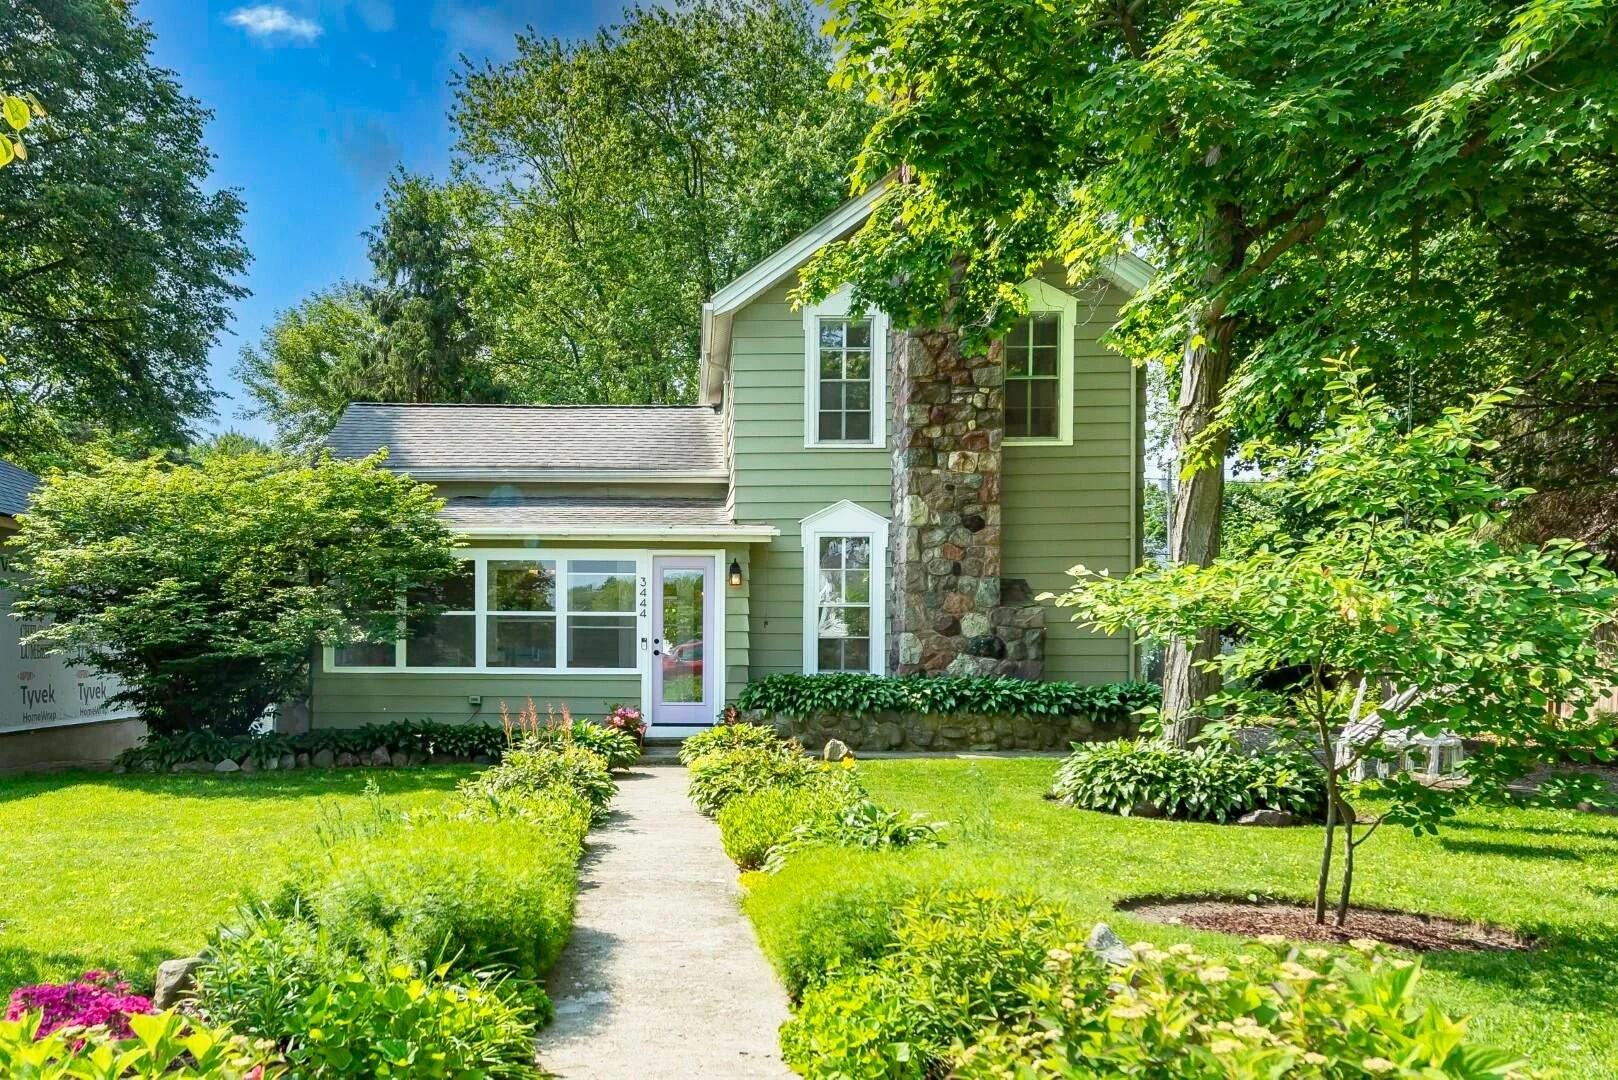
3444 Broad sold for $476,000 in 2025
2025 Stats
Sales : 20
Avg Sale Price : $402,325
Avg $ / SQ FT : $297
Avg List / Sale : 101.56%
2016 vs Now :
Number of Sales : - 33%
Avg Sale Price : +81%
Avg $ per SQ FT: +72%
Avg List / Sale : + 5.8%
Dexter Takeaways :
Inventory is tight in Dexter. With a population around 5,000, this shouldn’t be a surprise, but only 20 single family starter homes sold in 2025 is a chilling stat.
Homes sold for 1.56% above asking price in 2025, the highest of any city in Washtenaw County, giving Dexter the highest demand distinction.
Advice to First Time Dexter Buyers :
Be patient, but act swiftly. Inventory is rare, but moves FAST. Get your pre-approval letter / proof of funds letter ready before touring homes.
Be ready to compete in multiple offer situations. This will likely mean paying slightly above the asking price or providing inspection leniencies (this is different than waiving the inspection altogether) to seal the deal.
Get ready to swing a hammer. Most of the starter homes in Dexter are oozing with charm and deferred maintenance.
SALINE

113 W Russell sold for $199,990 in 2016
2016 Stats
Sales : 47
Avg Sale Price : $203,780
Avg $ / SQ FT : $174
Avg List / Sale : 96.04%
215 Monroe sold for $375,000 in 2025
2025 Stats
Sales : 25
Avg Sale Price : $346,157
Avg $ / SQ FT : $288
Avg List / Sale : 97.88%
2016 vs Now :
Number of Sales : - 47%
Avg Sale Price : +70%
Avg $ per SQ FT: +65%
Avg List / Sale : + 1.84%
Saline Takeaways :
Downtown homes in Saline experienced a higher rate of growth versus the more suburban homes >1 mile from Salt Springs Brewery.
Sluggish List / Sale ratios (97.88% of asking price) despite extremely light inventory (~2 sales per month) does not inspire a lot of confidence for sellers looking for quick sales and leverage on the back end of transactions.
Advice to First Time Saline Buyers :
Consult with your realtor about how much negotiating leverage you have. There might be opportunities to save money on the sale price, or score concessions from the seller with your offer.
Weigh the pros and cons of new construction. There are some appealing developments with finance incentives available.
Be aware of data center backlash in Saline Twp. We don’t have enough data (pun intended) to know how this will impact resale value, but it’s something to consider if you are looking in more rural parts of Saline.
CHELSEA
756 Taylor sold for $185,000 in 2016
2016 Stats
Sales : 21
Avg Sale Price : $181,657
Avg $ / SQ FT : $146
Avg List / Sale : 94.13%
730 N Main St sold for $380,000 in 2025
2025 Stats
Sales : 23
Avg Sale Price : $350,869
Avg $ / SQ FT : $284
Avg List / Sale : 99.07%
2016 vs Now :
Number of Sales : +9%
Avg Sale Price : +93%
Avg $ per SQ FT: +94%
Avg List / Sale : + 4.94%
Chelsea Takeaways :
Downtown Chelsea remains a hidden gem. Despite being home to the renowned Purple Rose Theater, Common Grill, Agricole, and other quaint downtown shops, demand has been mild for starter homes here.
Sale prices and $ per SQ FT has ballooned over the last 10 years. Property was very affordable here in 2016. In 10 years, we will likely be saying that same thing about 2026 home values in Chelsea.
Advice to First Time Chelsea Buyers :
Don’t sleep on Chelsea’s downtown! Before starting your home search in earnest, explore Chelsea to see if it’s a fit for you.
Similar to Dexter and Saline, you’ll need to be patient when it comes to inventory.
Many of the single family starter homes are located on main thoroughfares so be sure to check for road noise before writing an offer.
If you like running or biking on gravel roads, downtown Chelsea is an unbelievable launch point.
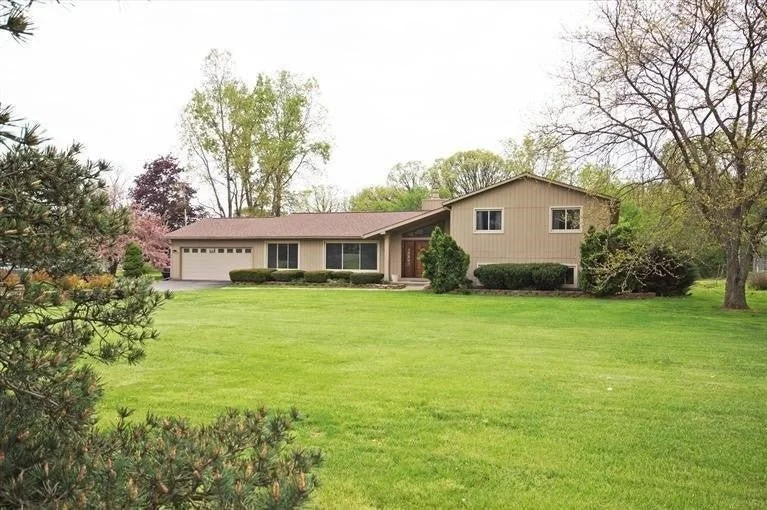
Rural Properties
in Washtenaw County
Criteria :
3+ BR Single Family Home
2 - 15 Acres
1500+ SQ FT
ANN ARBOR
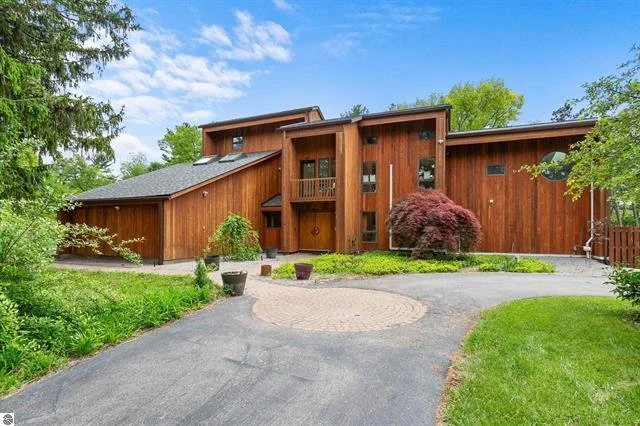
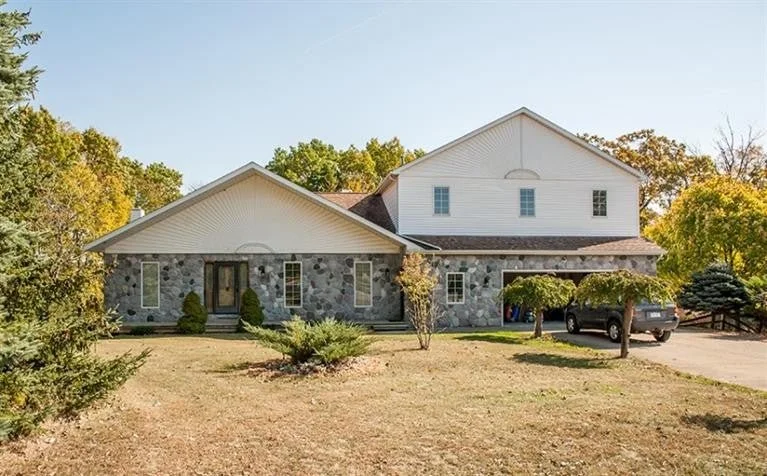
4390 W Ellsworth Rd sold for $547,500 in 2016.
2016 Stats
Sales : 63
Avg Sale Price : $568,779
Avg $ / SQ FT : $188
Avg List / Sale : 94.07%
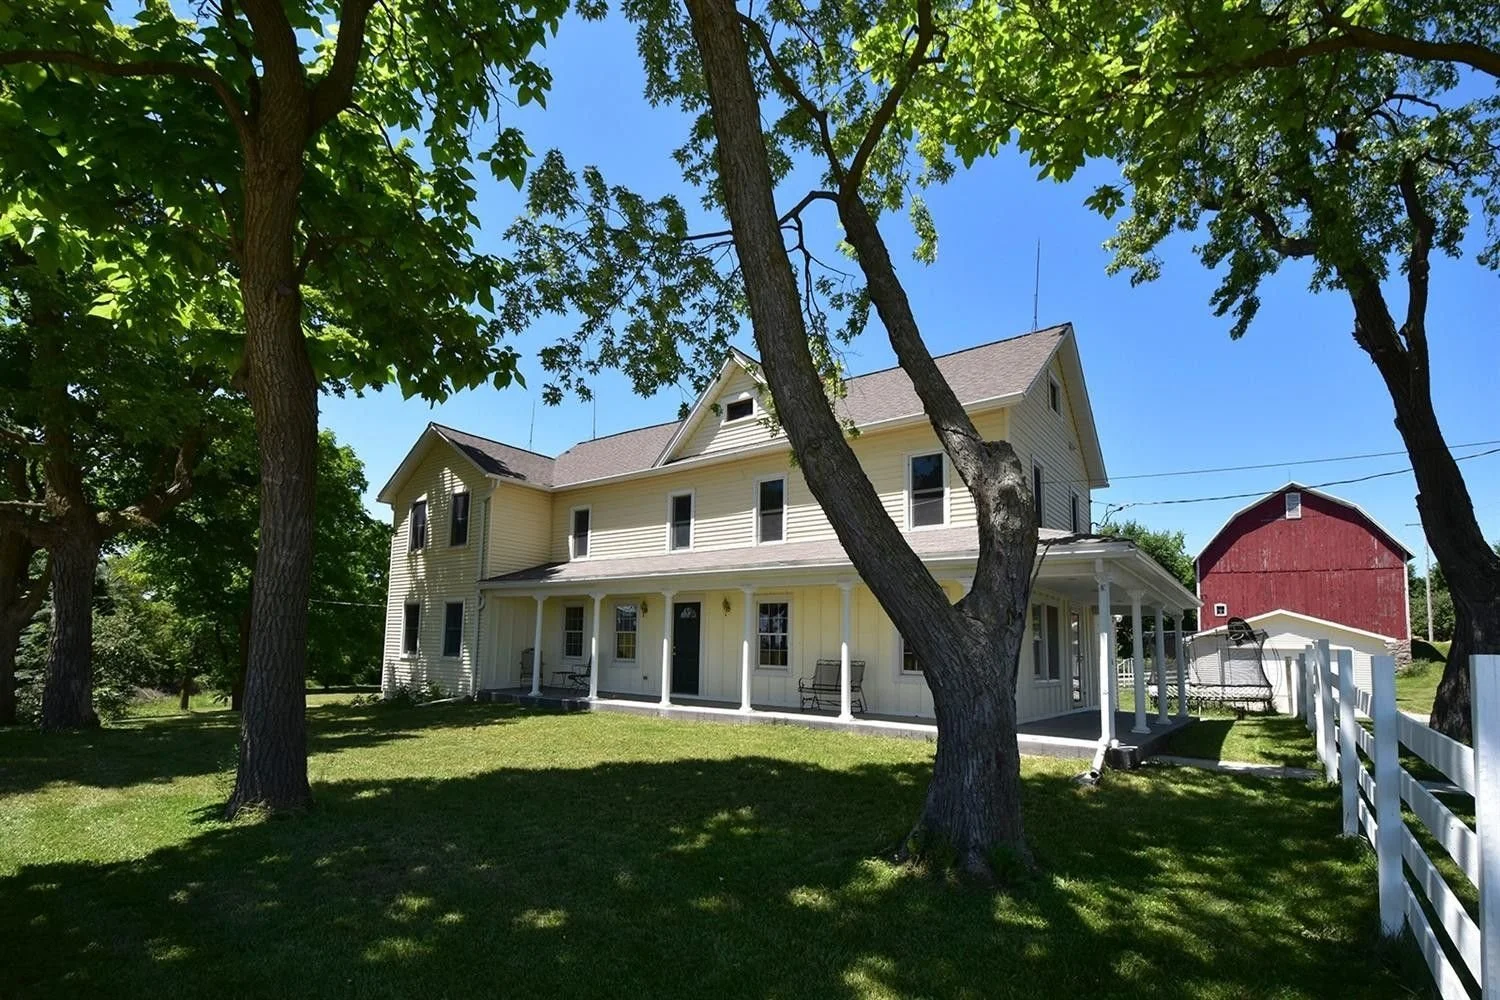
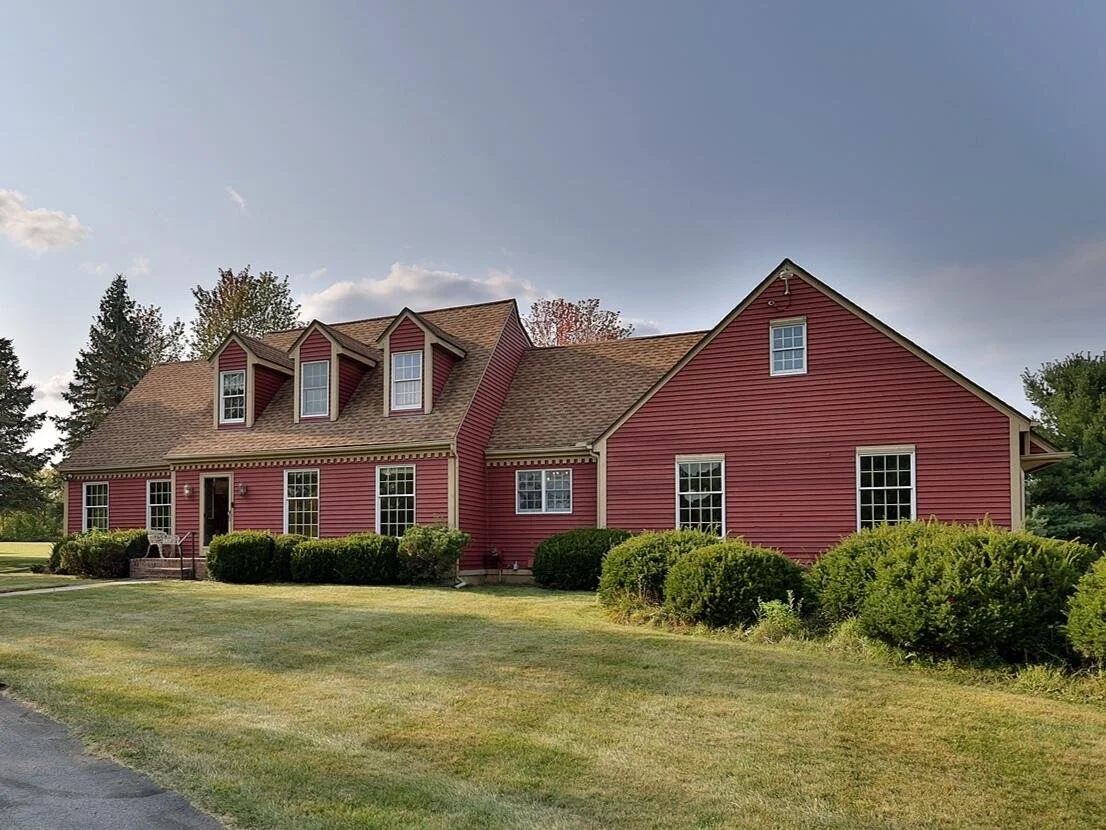
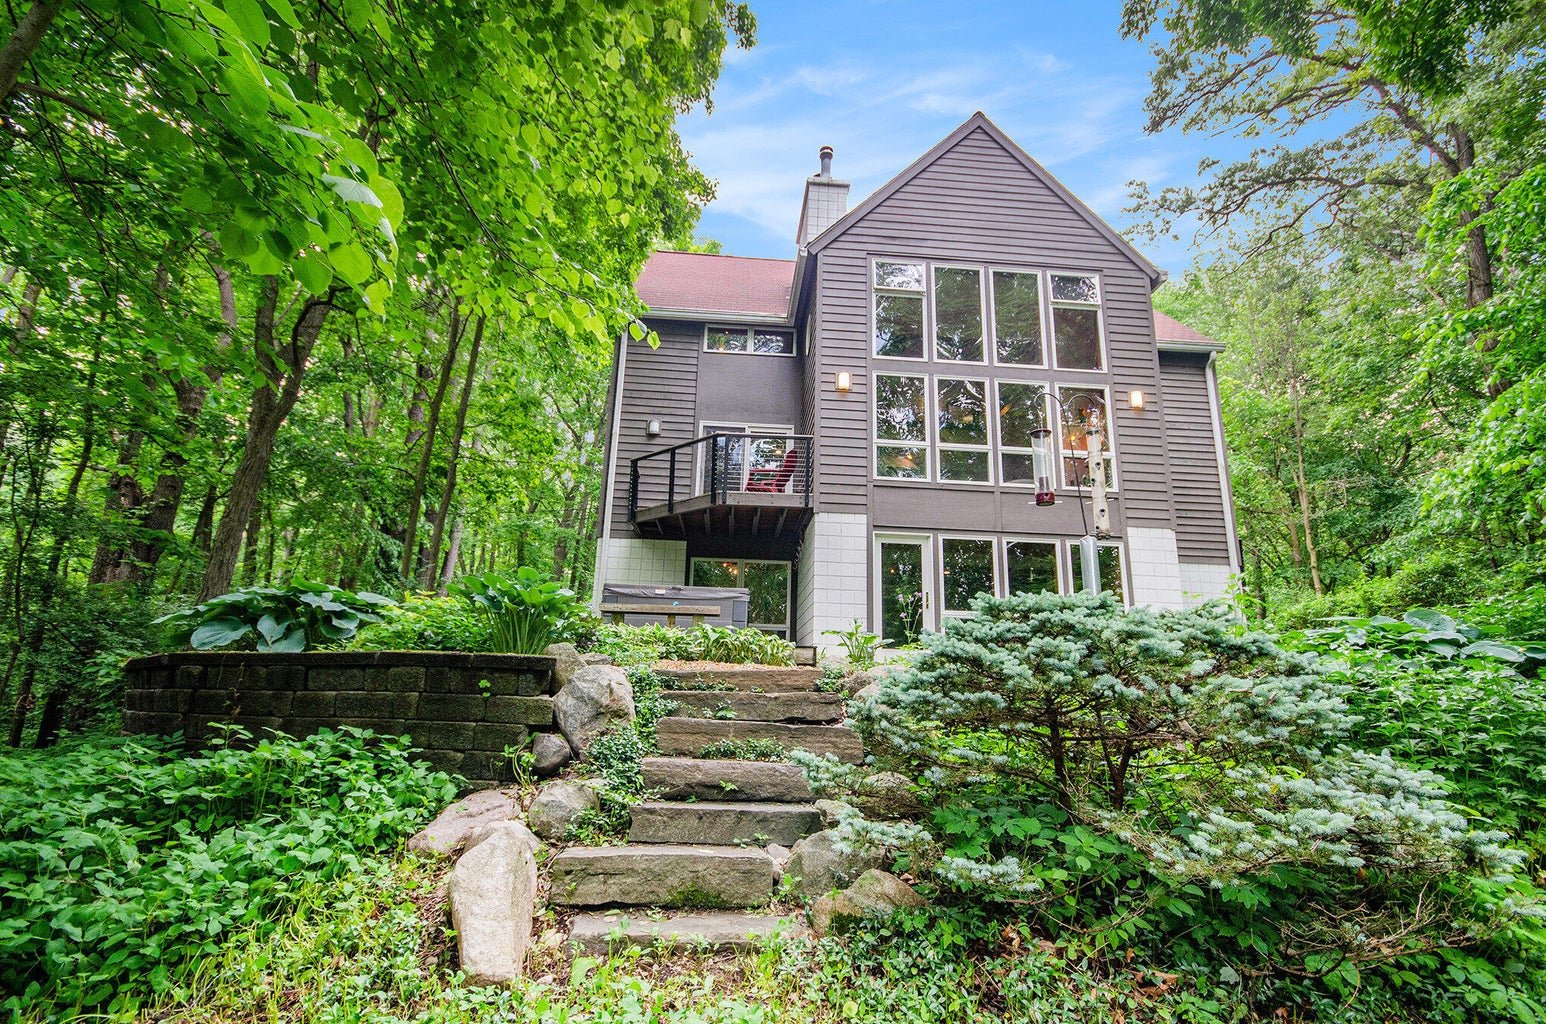
4340 E Huron River Dr sold for $1,150,000 in 2025.
2025 Stats
Sales : 56
Avg Sale Price : $958,856
Avg $ / SQ FT : $315
Avg List / Sale : 94.22%
2016 vs Now :
Number of Sales : -11%
Avg Sale Price : +69%
Avg $ per SQ FT: +68%
Avg List / Sale : + 0.15%
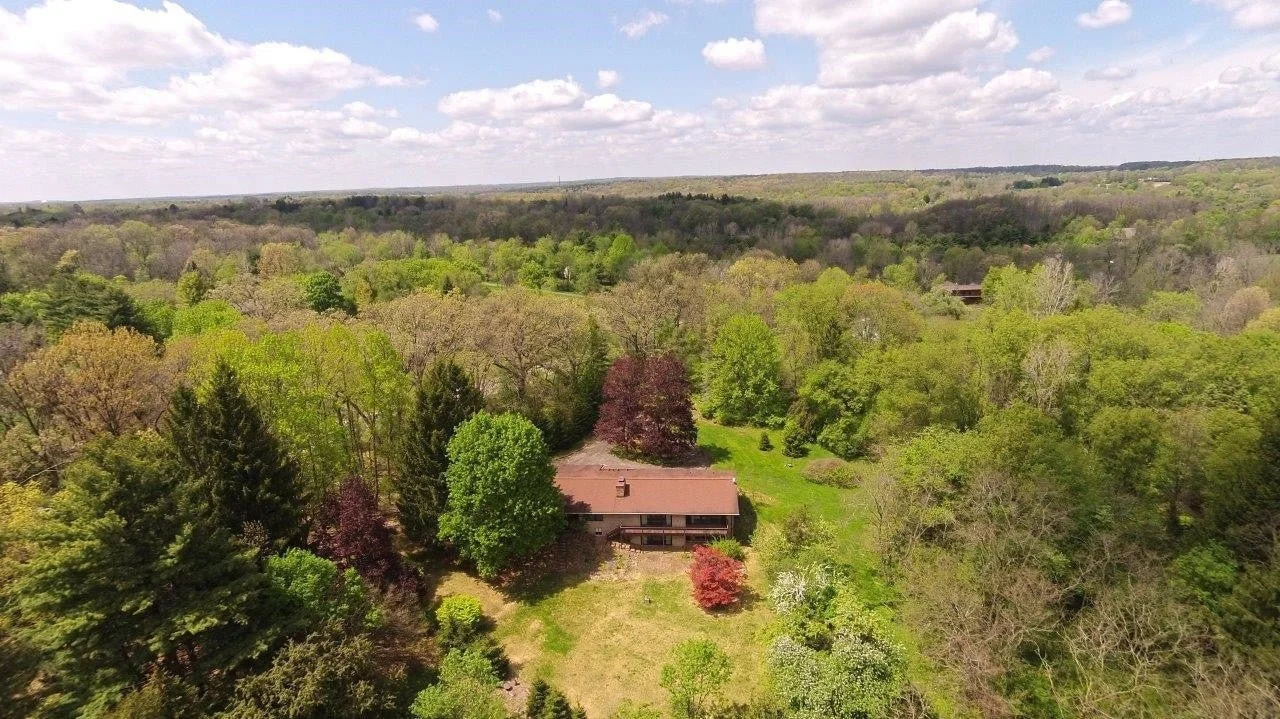
Ann Arbor Takeaways :
The increase in sale price (69%) since 2016 mirrors the Ann Arbor starter home market
There were more properties with 2 - 15 acres sold in Ann Arbor than any other city on our list
The 94.22% List / Sale ratio in 2025 shows that demand has tapered despite strong gains since 2016. This might be the result of many sales in more suburban areas, where demand wasn’t as high.
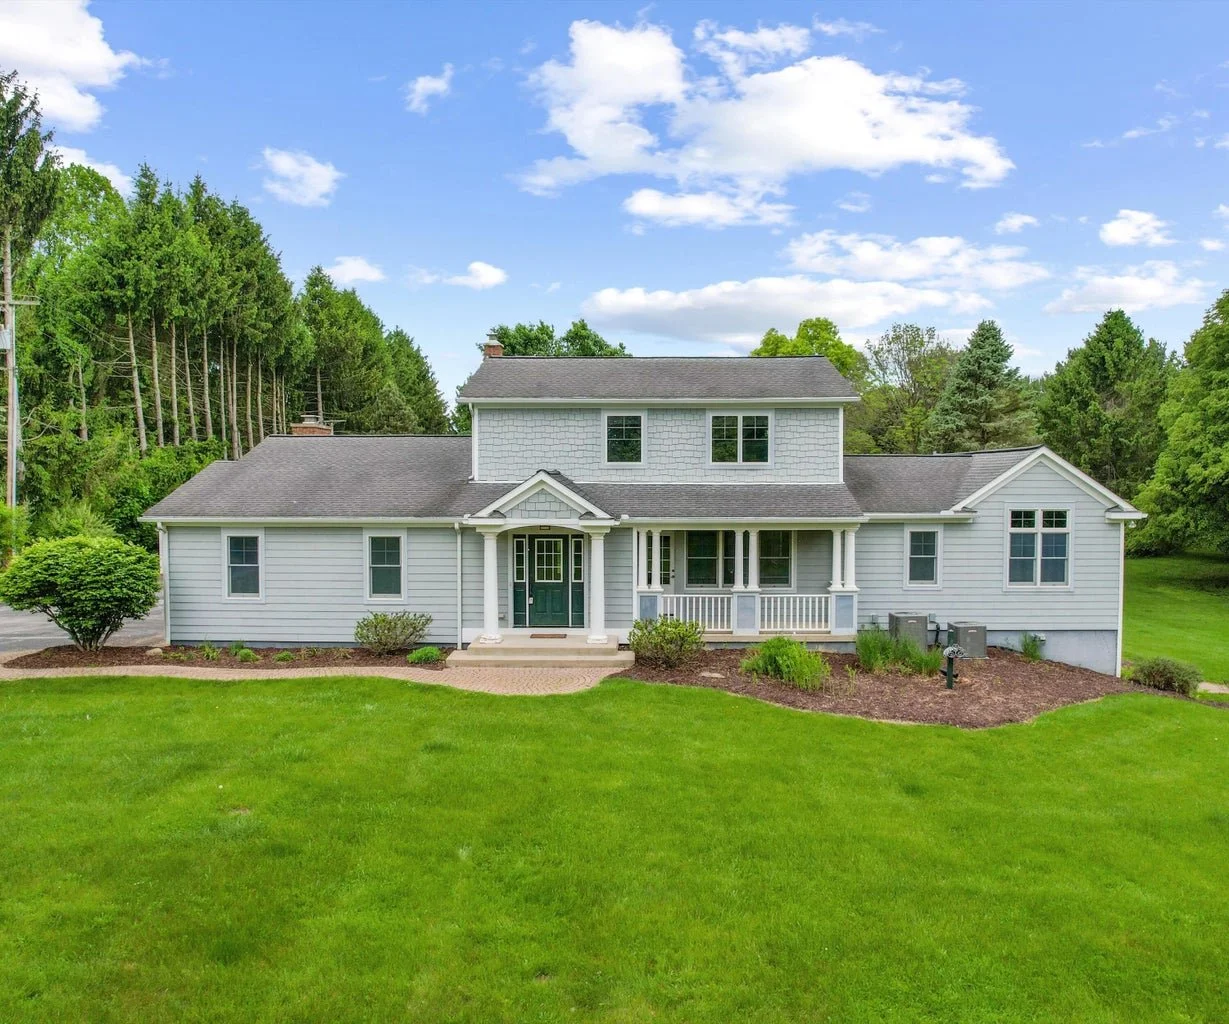
YPSILANTI
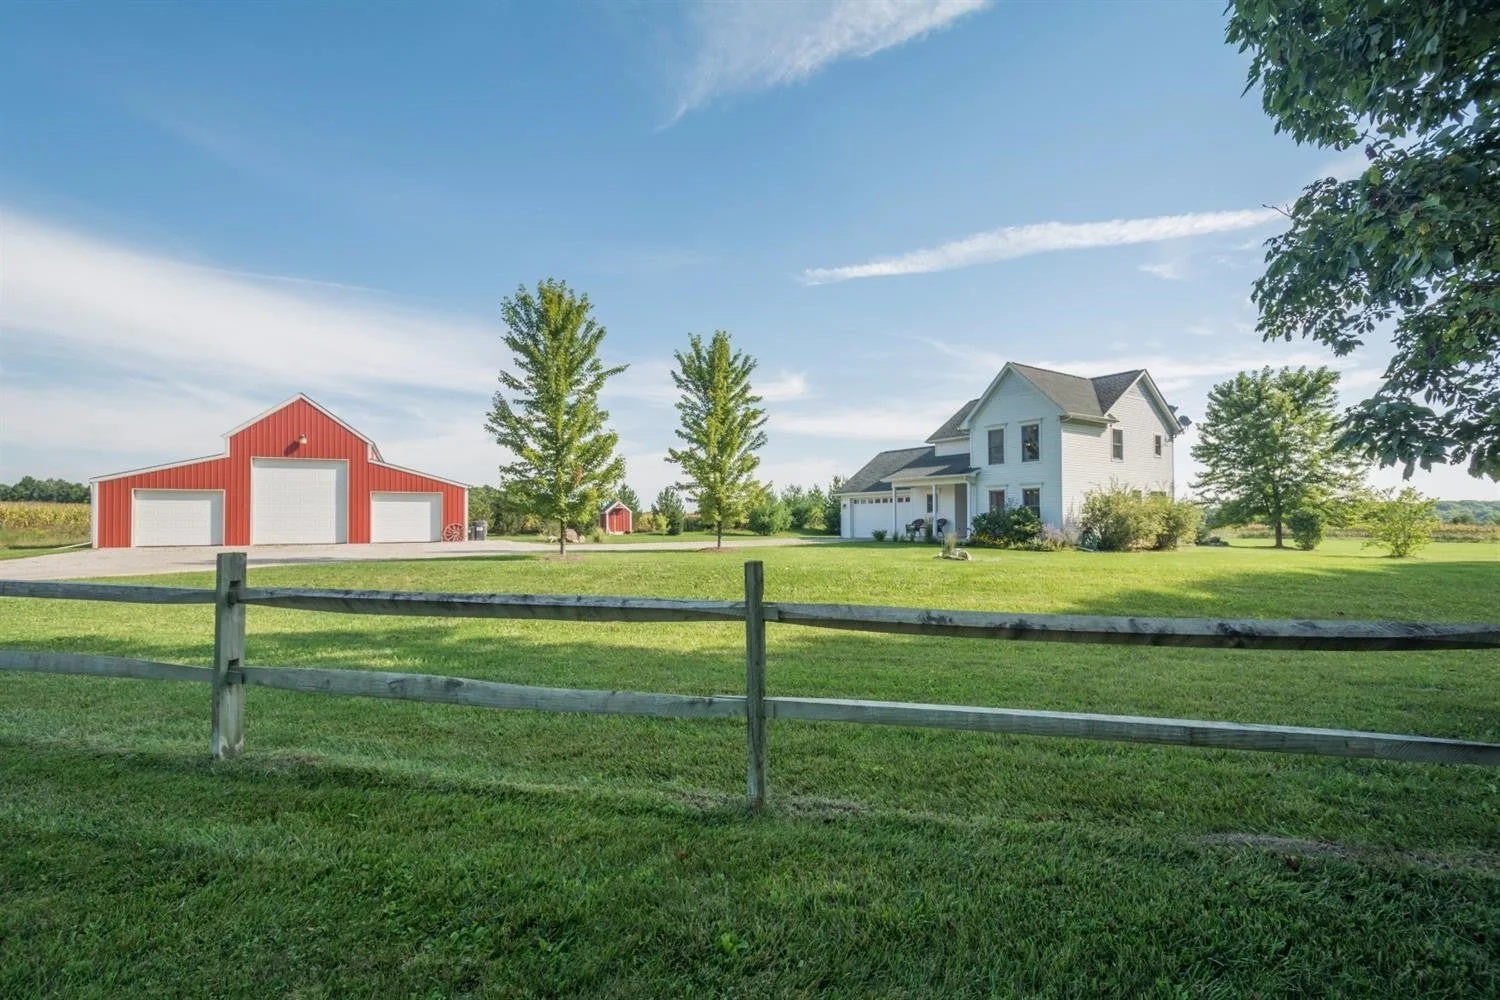
7354 Textile sold for $280,000 in 2016
2016 Stats
Sales : 26
Avg Sale Price : $334,103
Avg $ / SQ FT : $130
Avg List / Sale : 92.95%
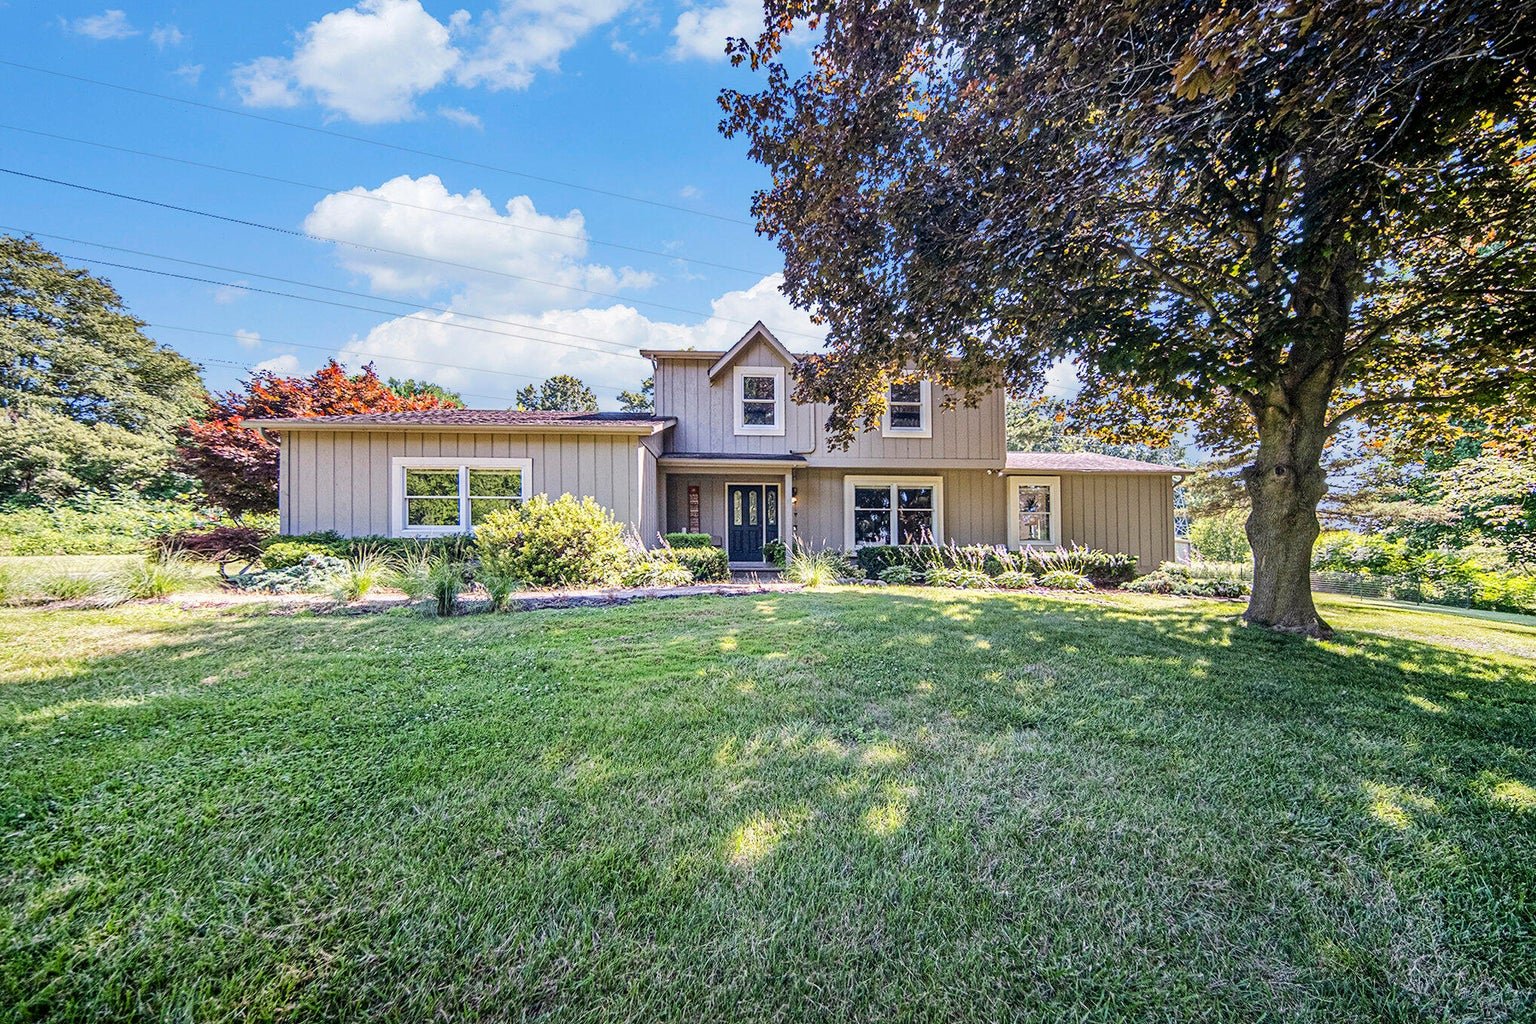
2244 Rivendell Ln sold for $575,000 in 2025.
2025 Stats
Sales : 15
Avg Sale Price : $591,613
Avg $ / SQ FT : $248
Avg List / Sale : 101.91%
2016 vs Now :
Number of Sales : -42%
Avg Sale Price : +77%
Avg $ per SQ FT: +91%
Avg List / Sale : + 8.96%
Ypsi Takeaways :
Once again, Ypsi outperforms Ann Arbor in increased value since 2016.
101.9% List / Sale ratio also shows that the average asking price has not caught up to the red hot buyer demand.
Ypsi Twp / Superior Twp have gained traction among Gen X and elder Millenials enticed by lower property taxes, a lower barrier to entry than Chelsea / Dexter, and proximity to downtown Ypsi.
DEXTER
2250 Zeeb Rd sold for $420,000 in 2016.
2016 Stats
Sales : 54
Avg Sale Price : $428,848
Avg $ / SQ FT : $167
Avg List / Sale : 94.99%
4641 Wylie sold for $740,000 in 2025.
2025 Stats
Sales : 37
Avg Sale Price : $731,353
Avg $ / SQ FT : $282
Avg List / Sale : 102.08%
2016 vs Now :
Number of Sales : -31%
Avg Sale Price : +71%
Avg $ per SQ FT: +69%
Avg List / Sale : + 7.1%
Dexter Takeaways :
Dexter had 85% more “homestead” properties hit the market in 2025 than starter homes.
Read the staggering stat above one more time.
Buyer demand was potent in 2025, with the average property selling for 2% above list.
CHELSEA
3083 Chilsholm Trail sold for $360,000 in 2016.
2016 Stats
Sales : 42
Avg Sale Price : $340,917
Avg $ / SQ FT : $149
Avg List / Sale : 93.64%
13663 Waterloo Rd sold for $735,000 in 2025.
2025 Stats
Sales : 33
Avg Sale Price : $708,518
Avg $ / SQ FT : $285
Avg List / Sale : 100.33%
2016 vs Now :
Number of Sales : -21%
Avg Sale Price : +108%
Avg $ per SQ FT: +91%
Avg List / Sale : + 6.7%
Chelsea Takeaways :
Chelsea experienced the strongest appreciation since 2016 from our list, with the average sale price increasing by 108%, and $ / SQ FT going up by 91%.
Chelsea outperformed Dexter by a hair, but there is a lot of overlap between townships and school districts, especially in Lima Twp.
SALINE
11321 Mooreville Rd sold for $385,000.
2016 Stats
Sales : 24
Avg Sale Price : $366,933
Avg $ / SQ FT : $145
Avg List / Sale : 94.37%
1653 W Willis Rd sold for $550,000 in 2025.
2025 Stats
Sales : 14
Avg Sale Price : $684,750
Avg $ / SQ FT : $268
Avg List / Sale : 98.09%
2016 vs Now :
Number of Sales : -42%
Avg Sale Price : +87%
Avg $ per SQ FT: +85%
Avg List / Sale : + 5.7%
Saline Takeaways :
Rural homesteads are slim pickings in Saline.
One reason why : Saline’s population density is substantially higher than Dexter and Chelsea. Saline has been a hotbed for higher density neighborhoods built by Pulte, MI Homes, Lombardo, and Casablanca.
With scarcity also comes value appreciation. WIth only 14 options in 2025, the average sale price has climbed 87% since 2016.
Downtown Ann Arbor Condos
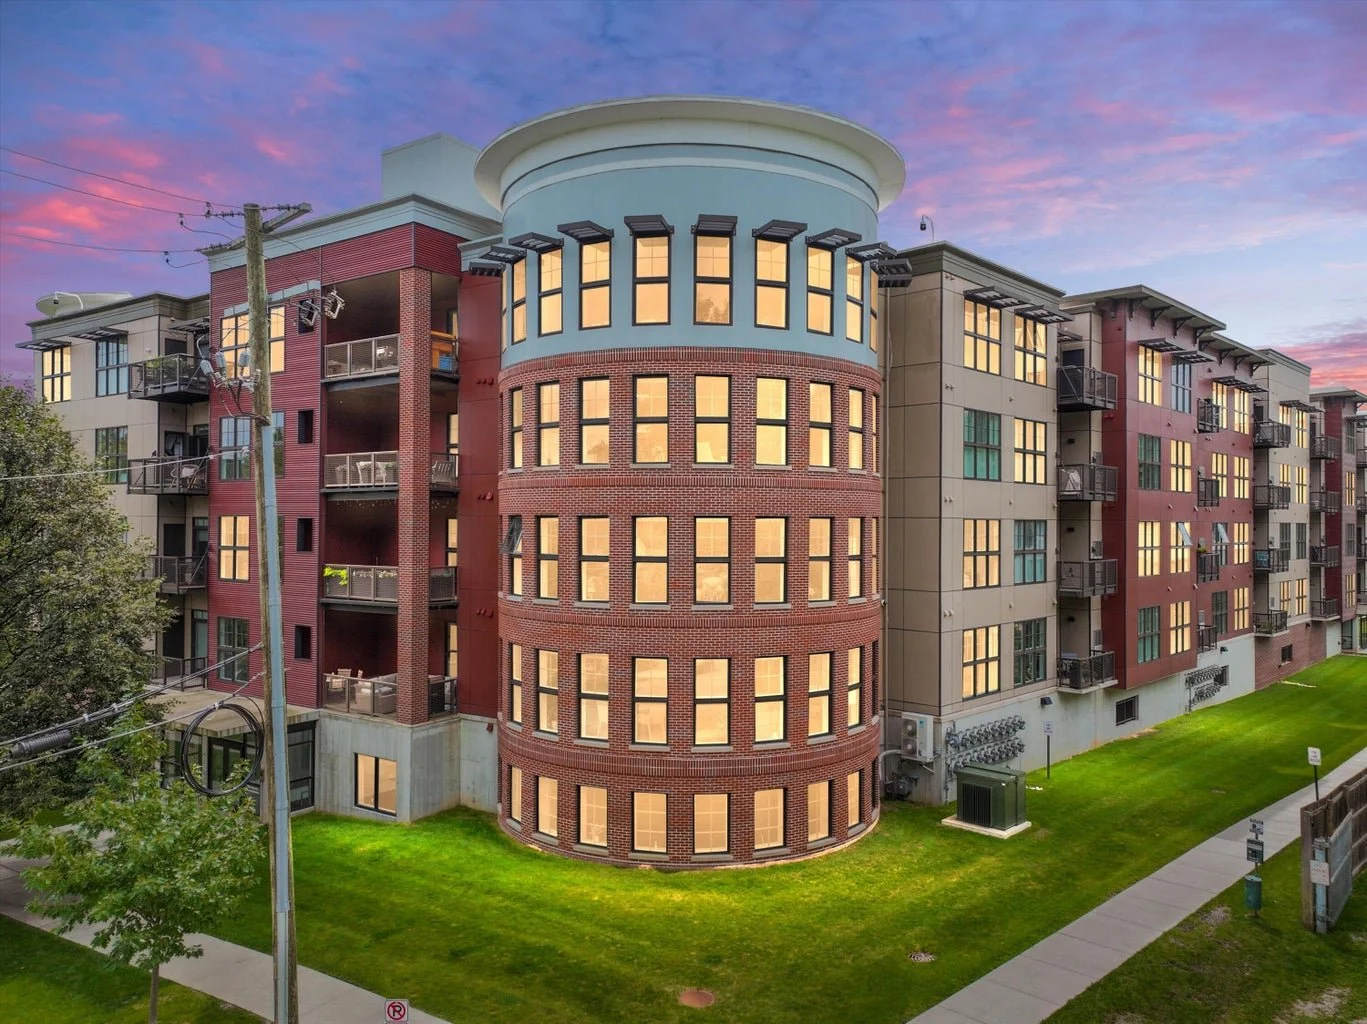
410 N First was built in 2017.
Criteria :
<0.5 mi of Kerrytown Market
Condo / Townhome
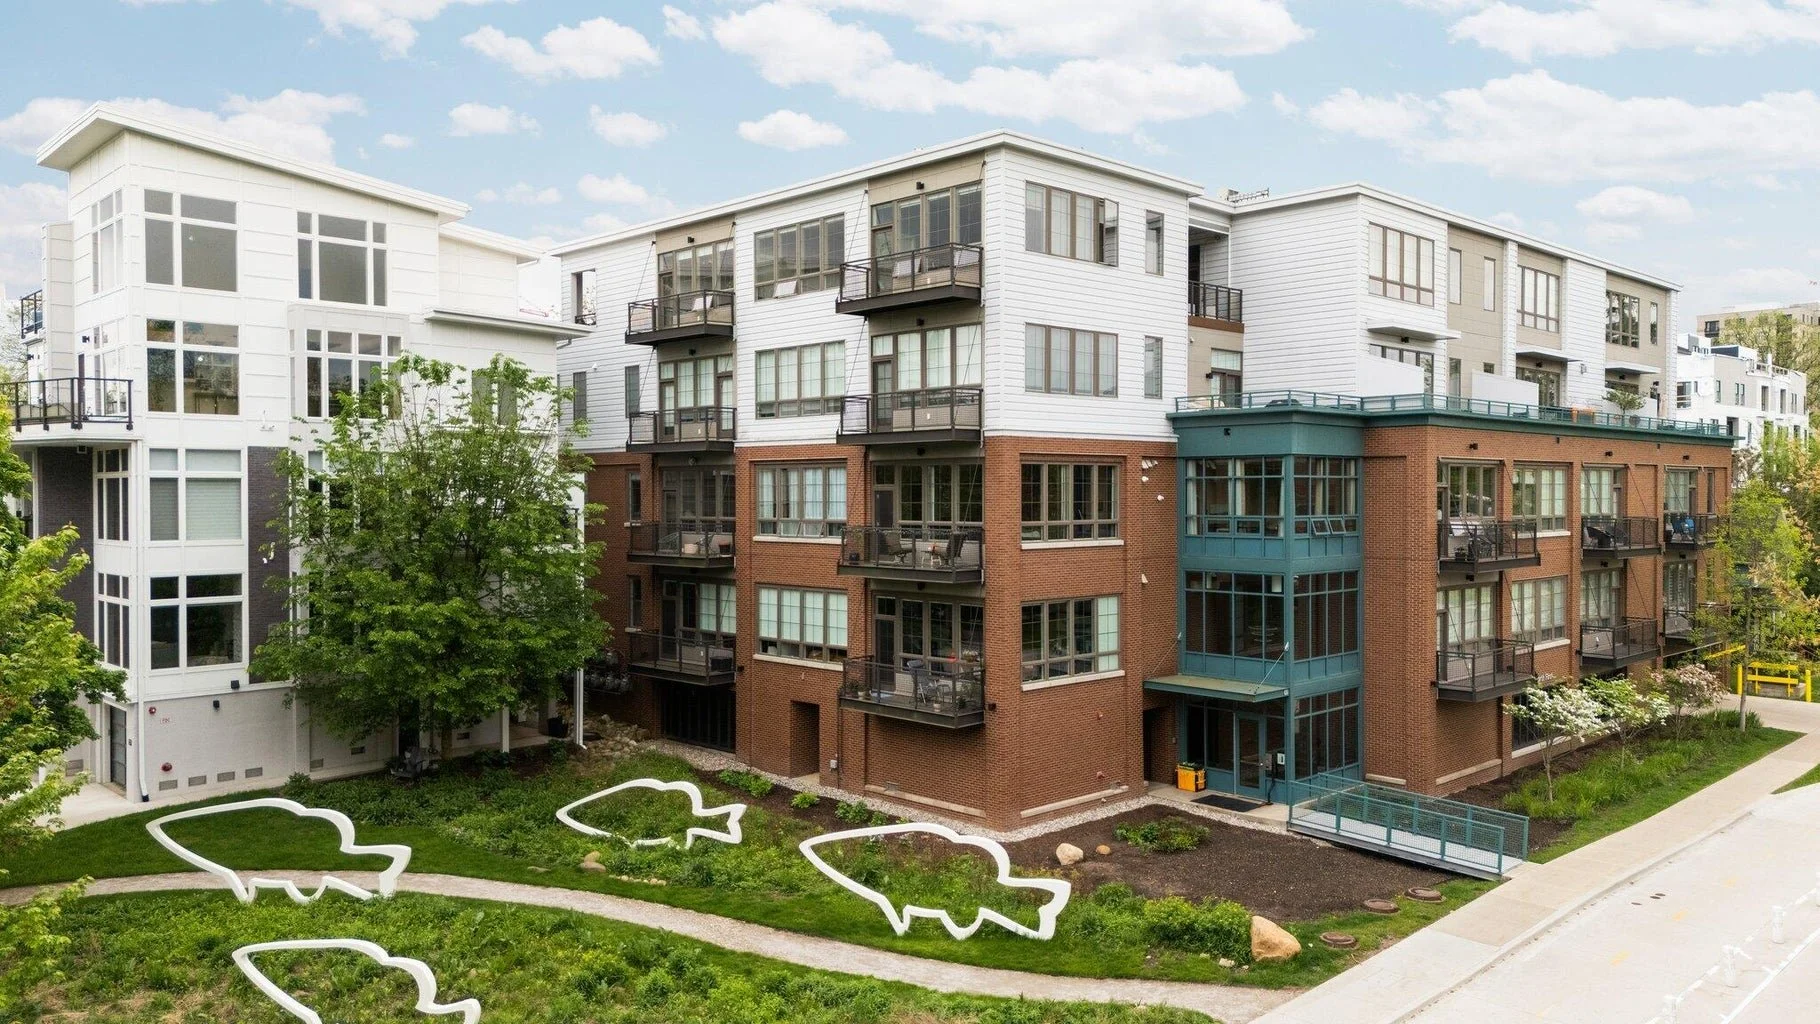
Liberty Lofts was built in 2006. This is my favorite downtown condo building.
2016 Stats
Sales : 63
Avg Sale Price : $383,384
Avg $ / SQ FT : $348
Avg List / Sale : 95.03%
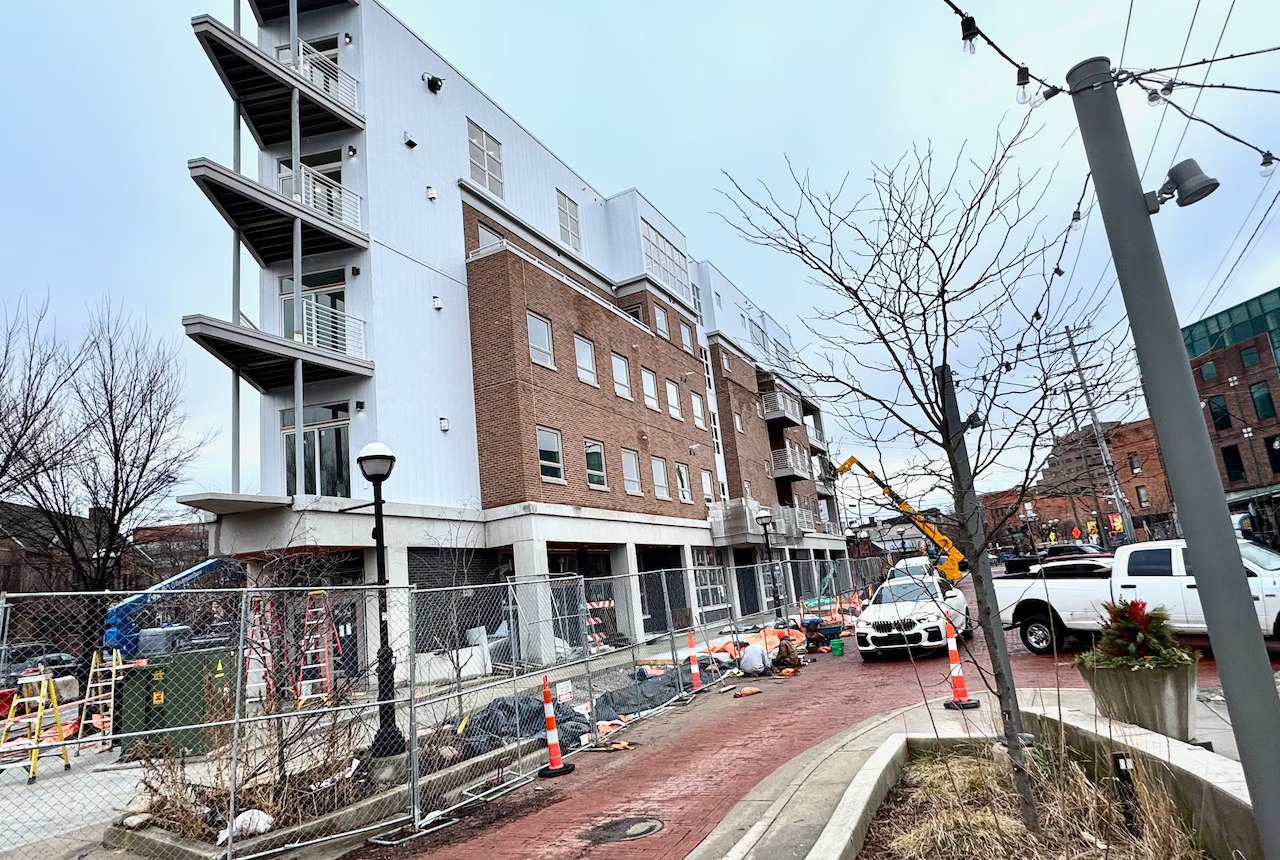
330 Detroit St is currently being built in Kerrytown.
2025 Stats
Sales : 67
Avg Sale Price : $577,592
Avg $ / SQ FT : $550
Avg List / Sale : 96.83%
2016 vs Now :
Number of Sales : +6.3%
Avg Sale Price : +50.6%
Avg $ per SQ FT: +58%
Avg List / Sale : + 1.8%
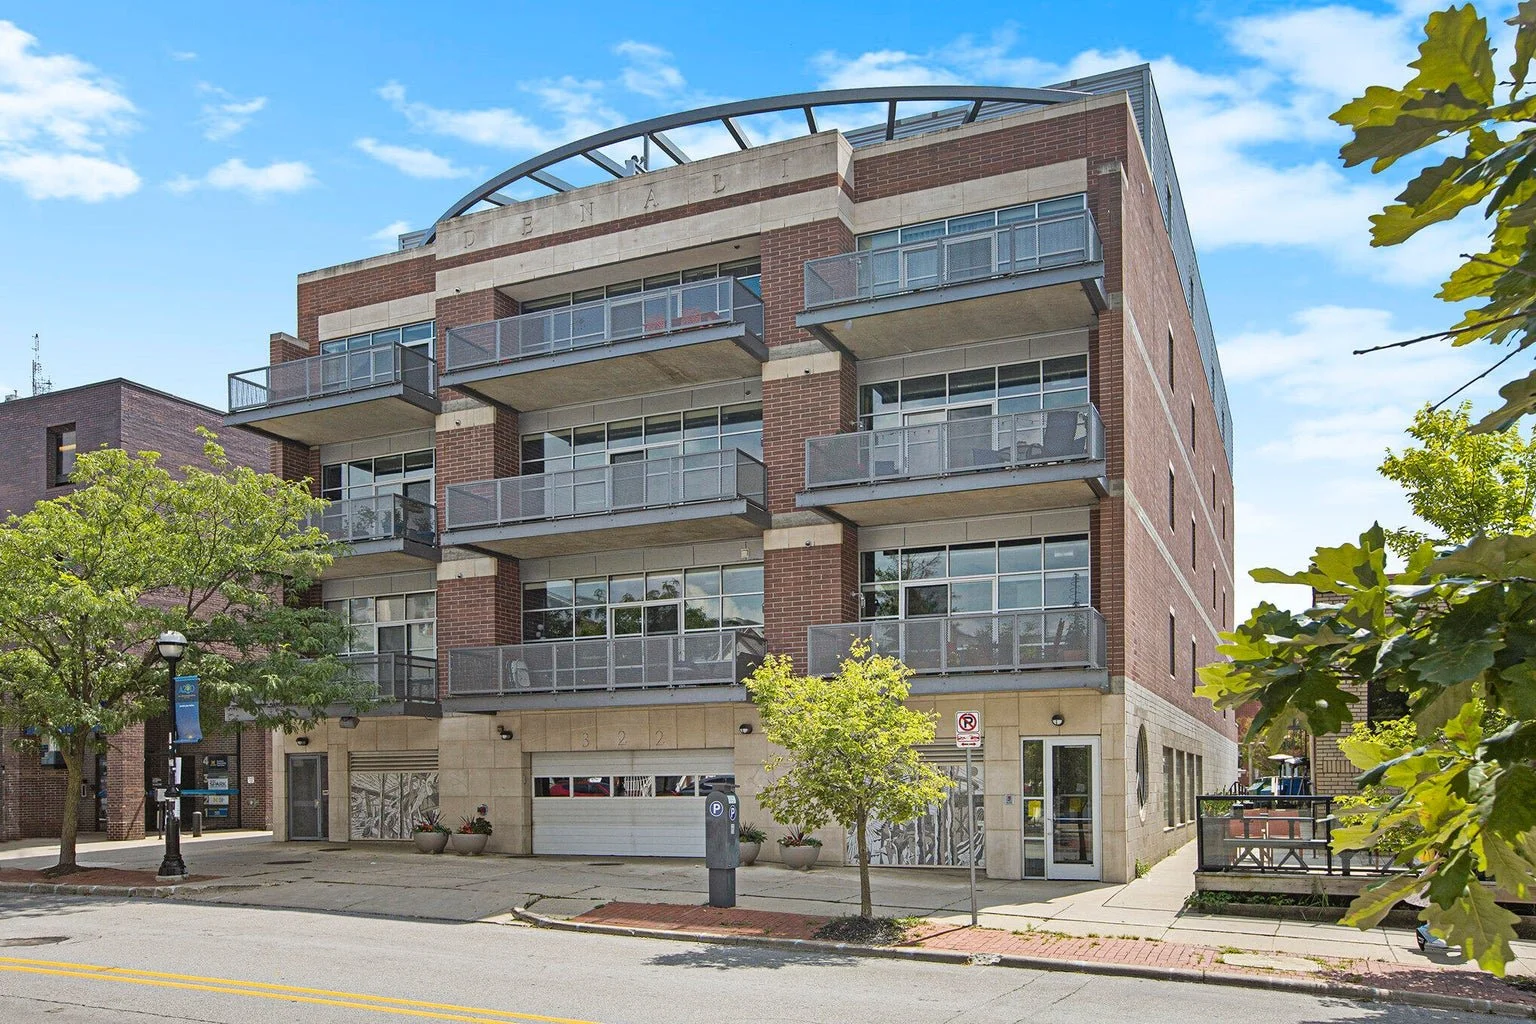
218 W Kingsley was built in 2018.
Case Study : 218 W Kingsley
2022 - 2025
Avg $ per SQ FT
2022 : $536
2023 : $574
2024 : $549
2025 : $573
Takeaways :
6.9% increase over 4 years shows signs of a market saturated with inventory, lack of demand, or some combination of both.
If we did the same exercise for all of the more recent builds downtown hovering around $1M per unit, this trend line would hold.
Market corrections are common in new condo developments, typically 5-7 years after the last unit is built.
J. Sinclair, luxe condos along the Cascades are being built and start at $2.8M.
Downtown Condo Takeaways :
In 2016, many of today’s most expensive downtown condos had not yet been built. That being said, the downtown condo market has had the weakest rate of appreciation from our list. A 5% YoY increase in sale price is nothing to sneeze at, but it pales in comparison to Washtenaw County starter homes and rural properties.
Buying a downtown condo makes sense as a lifestyle choice, but not as a pure investment play. Between high carrying costs (HOA dues, high property taxes) and a saturated downtown rental market, this should be a stay-away for any income property sharks reading this.
There are at least 52 new condo projects in the works in Ann Arbor. Learn more about them in this MLive article, from my favorite reporter, Ryan Stanton.
With so many crains in the sky downtown, it will be interesting to see which buildings resonate with buyers in a crowded market.
Closing Thoughts
Life is unpredictable. No one knows what the next ten years will bring us, but I appreciate you taking a look back on the last ten with me.
As always, thanks for reading.